
Like SQL statements, one of the most-notorious causes of ABAP performance problems is internal tables with many entries. Large internal tables consume massive amounts of memory and CPU, for example, during copy, sort, or search operations.
You can use the ABAP debugger to create an overview of all internal tables of a program. The ABAP debugger is a tool for performing functional troubleshooting in programs. You can find more detailed descriptions of the debugger in SAP literature under ABAP programming. You’ll find information on main memory usage both in the classic and the new debugger. You can set the debugger in the ABAP Editor (Transaction SE38) via Utilities > Settings > Debugging.
Performance analysis using the ABAP debugger isn’t a standard procedure and is best performed by an ABAP developer.
Rules When Debugging
Take the following advice into account when working with the ABAP debugger. During the debugging process, the ABAP program may terminate and display the error message Invalid interruption of a database selection, or the system may automatically trigger a database commit.
In either case, an SAP Logical Unit of Work (LUW) has been interrupted, and this may lead to inconsistencies in the application tables. Therefore, you should only debug on a test system or in the presence of someone who is very familiar with the program being analyzed and who can manually correct inconsistencies in the database tables if necessary. See “Debugging Programs in the Production Client” in SAP Online Help for the ABAP debugger.
You perform a performance analysis with the debugger as follows:
- Start the program to be analyzed. Then open a second session. Here you can monitor the program to be analyzed in the work process overview (Transaction SM50). Enter the debugger from the work process overview by selecting the Debugging function. By using the debugger several times in succession, you can identify the parts of the program that cause high CPU consumption. Often, these sections consist of LOOP ... ENDLOOP statements that affect large internal tables.
- To display the current memory requirements (in the “classic” debugger), select Goto > Other Screens > Memory Use.
- Check for cases of unnecessary memory consumption that may have been caused by a nonoptimal program or inefficient use of a program. As a guideline, bear in mind that a program being used by several users in dialog mode should not allocate more than 100MB.
- As of SAP NetWeaver AS ABAP 6.20, you can use the classic debugger to create a list of program objects located in the memory by selecting Goto > Status Display > Memory Use. Under Memory Consumption, the Ranking Lists tab contains a list of objects and their memory consumption.
In SAP NetWeaver AS ABAP versions 4.6 und 6.10, you can obtain a memory consumption list by choosing Goto > System > System Areas. Enter “ITAB-TOP25” in the Area field. This way, you’ll obtain a list of the 25 largest internal tables.
5. In the “new” debugger, you first display the memory analysis tool by clicking the button for the new tool and then selecting Memory Analysis from the tools on offer in the Memory Management folder. The initial screen then displays how much memory is allocated or used by the analyzed internal session. Click the Memory Objects button to go to the list of the largest memory objects, which can be the internal tables, objects, anonymous data objects, or strings.
Memory Extracts
Moreover, you can create and then analyze a memory extract, that is, an overview of the objects that occupy memory space. You can create a memory extract in any transaction by selecting System > Utilities > Memory Analysis> Create Memory Extract or simply enter function code “/HMUSA”. The third option is to create a memory extract from program coding. Refer to SAP Help for a description of the system class CL_ABAP_MEMORY_UTILITIES.
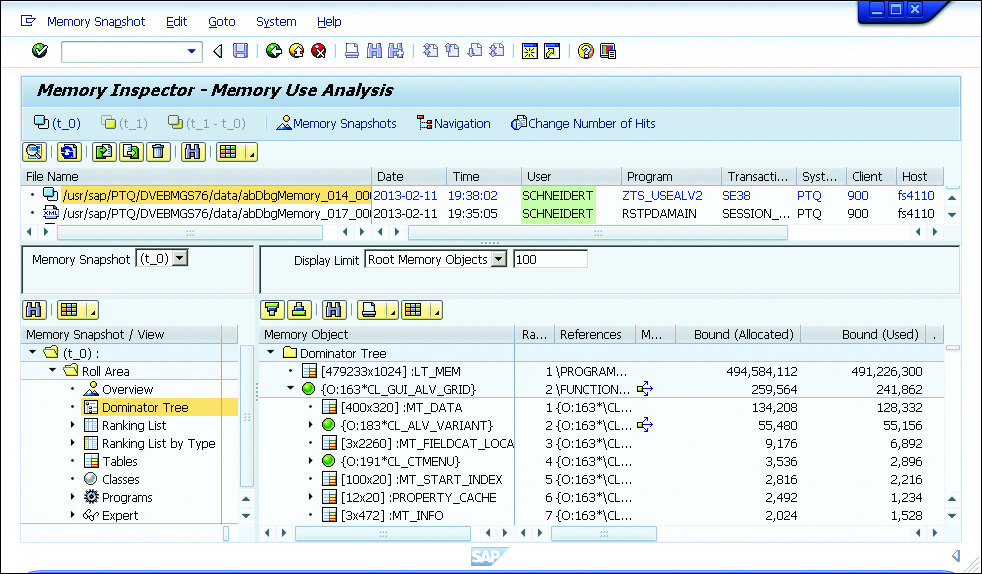
To evaluate the memory extract, start the Memory Inspector by selecting System _ Utilities > Memory Analysis > Compare Memory Extracts in any transaction or via Transaction S_MEMORY_INSPECTOR. The Memory Inspector lists all memory extracts in the upper part of the screen. In the lower part of the screen, you can find details about the individual memory extract.
Here, a distinction is made among the object types, programs, classes, dynamic memory request of a class, table bodies, strings, and types of anonymous data objects. You’re provided with different ranking lists, according to which you can sort the objects. For each memory object, you’re provided with the values of bound allocated, bound used, referenced allocated, and referenced used memories. You can find a detailed description of the ranking lists and the displayed values in SAP Help.
Memory Inspector
The Memory Inspector is particularly useful for examining transactions over a long period of time, as is the case in a customer interaction center. Here, users frequently enter a transaction at the beginning of their workday and exit it when they go home. In these “long-term” transactions, data often remains, and therefore memory consumption continuously increases.
The figure below shows an example of a memory extract. The dominator tree shows the hierarchical program structure and the memory used by the program parts. With a size of 494MB, table LT_MEM is conspicuous. The next largest object is the CL_GUI_ALV_GRID class with a size of 250 KB. Below this class, 130 KB are used by table MT_ATA.
Conclusion
In order to find potential performance bottlenecks, it’s important to take a look at historical culprits such as SQL and ABAP code. With tools such as the ABAP debugger and Memory Inspector, analyzing the memory usage in your program becomes quite easy.
Editor’s note: This post has been adapted from a section of the book SAP Performance Optimization Guide: Analyzing and Tuning SAP Systems by Thomas Schneider.


Comments