SAP Data Intelligence includes two ways to gather system diagnostics: monitoring and troubleshooting.
Monitoring is implemented through an open-source tool and is available for cluster administrators only. SAP Data Intelligence has two open-source tools for monitoring purposes:
- Diagnostics Kibana web interface for consolidated application log analysis
- Diagnostics Grafana web UI for system and application metric monitoring
Both tools are installed in a single Kubernetes namespace along with other SAP Data Intelligence applications. Metrics and logs from other applications in that namespace are collected and made available for cluster admin users only.
Metrics about an SAP Data Intelligence system and all its component are collected and centrally stored as time series data in a Prometheus system. Prometheus collects Kubernetes-level information about all SAP Data Intelligence components including CPU usage, memory usage, Kubernetes pod statuses, and Docker container statuses. The metrics about SAP Data Intelligence components are exposed to a Prometheus system via a Representational State Transfer (REST) API endpoint. The Diagnostics Grafana web interface can be used to visualize Prometheus time series data to analyze the metrics gathered from SAP Data Intelligence components.
Note: Prometheus is an open-source software tool for monitoring and alerting. This tool records time series data about metrics using the HTTP pull model. Prometheus is configured in SAP Data Intelligence during installation, along with Elasticsearch. It is installed on Kubernetes disk storage, which is limited.
We’ll discuss diagnostics and metrics with Diagnostics Grafana in the following sections.
SAP Data Intelligence Diagnostics: Diagnostics Grafana
Diagnostics Grafana is an open-source web-based visualization tool for building interactive analytical dashboards. This tool is popular for monitoring application stacks in combination with time series databases like InfluxDB, Prometheus, and Graphite. SAP Data Intelligence application metrics are stored in Prometheus databases, so in our case, we’ll discuss using Diagnostics Grafana in collaboration with a Prometheus database.
Diagnostics Grafana is only available with the cluster admin role in SAP Data Intelligence. You must log on as a cluster or system admin to SAP Data Intelligence. Diagnostics Grafana will be available as tile on the SAP Data Intelligence launchpad (Diagnostics Grafana).
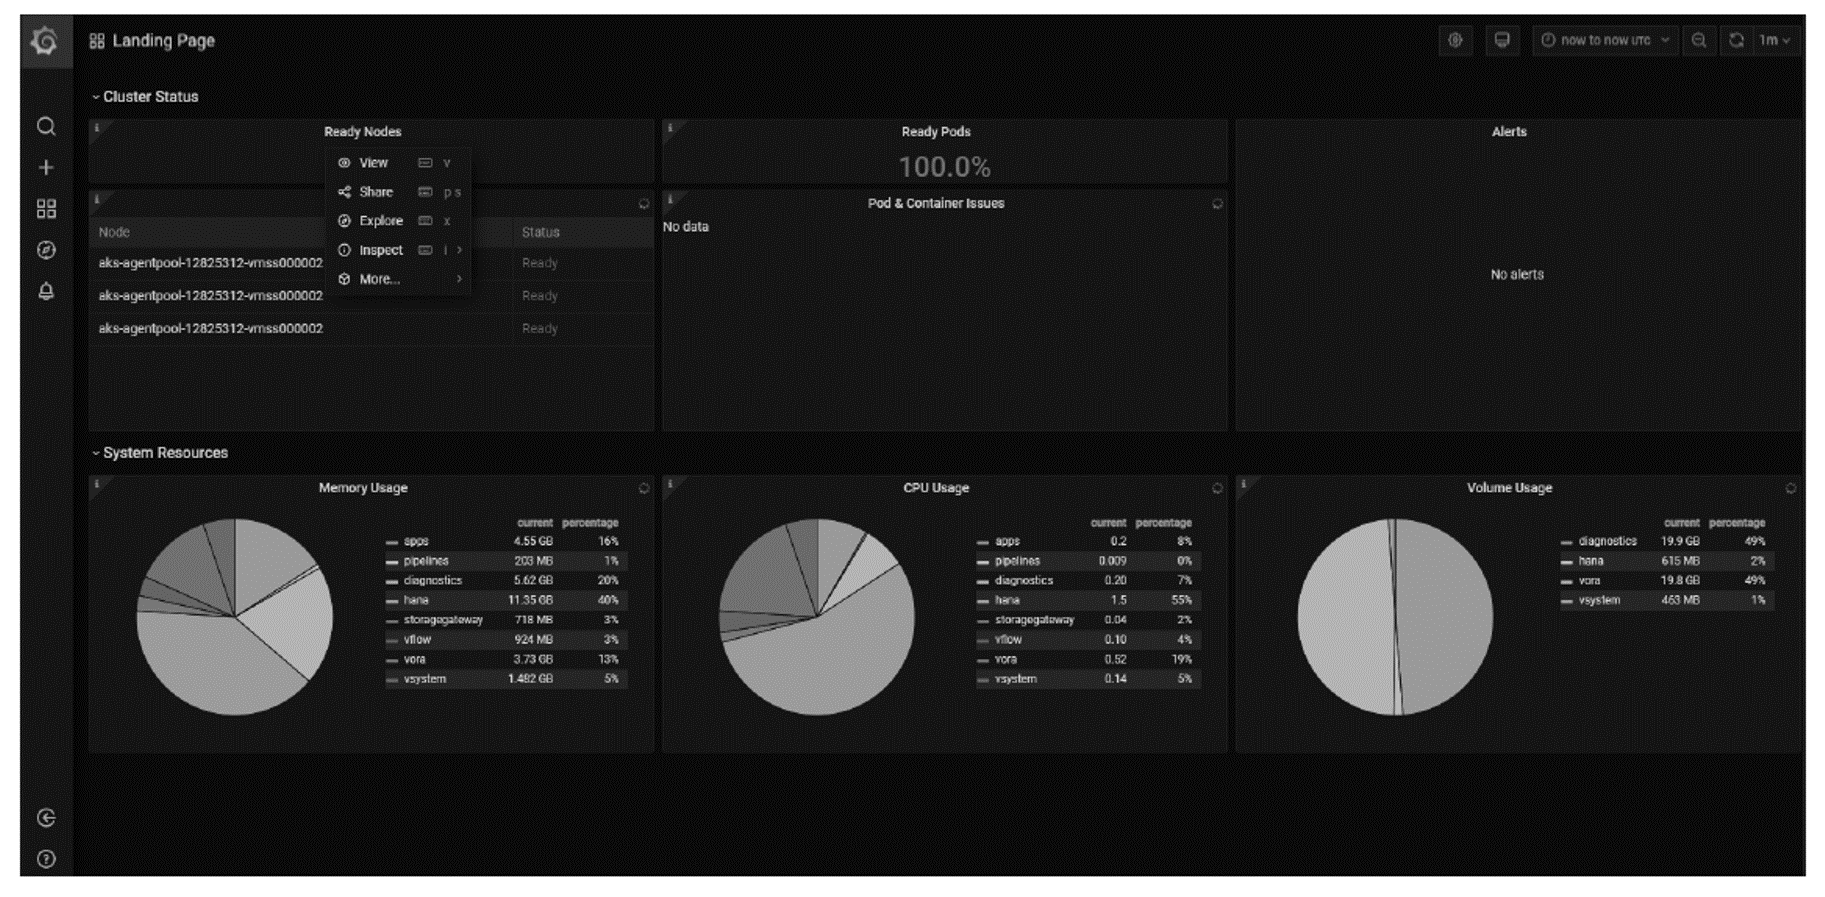
Diagnostics Grafana offers predefined dashboards that provide overviews of the cluster and its pods, including the CPU, memory, and volume usage of different components. The figure below shows an overview of the Diagnostics Grafana dashboard.
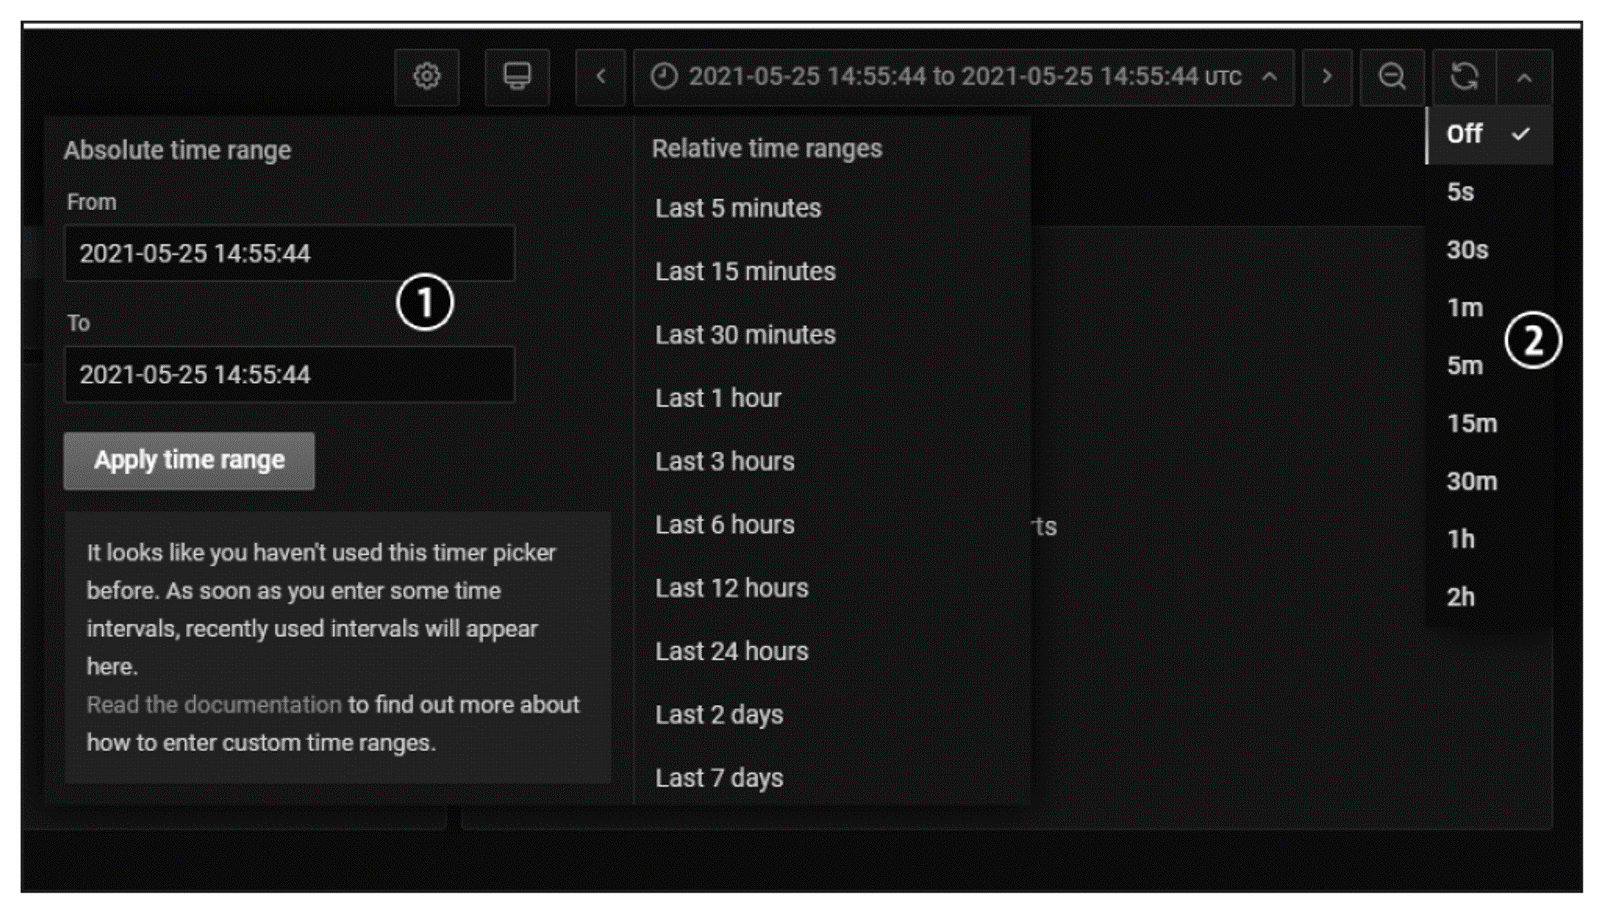
As shown in the next figure, you can filter the report by custom date range or by predefined relative date options 1. You can automatically or manually refresh the dashboard. If you set up autorefresh, the list of time intervals already available 2 is displayed.
17
You can also create your own dashboard via the Create Dashboard option (+), shown earlier.
Kubernetes Cluster Metrics
The Diagnostics Grafana web UI offers predefined dashboards for tracking Kubernetes cluster-level metrics. These standard dashboards are available under the Kubernetes folder of the Diagnostics Grafana web interface. As shown in the next figure, you’ll see the three folders for the standard dashboards related to Kubernetes cluster metrics, which are marked by the Kubernetes tag.
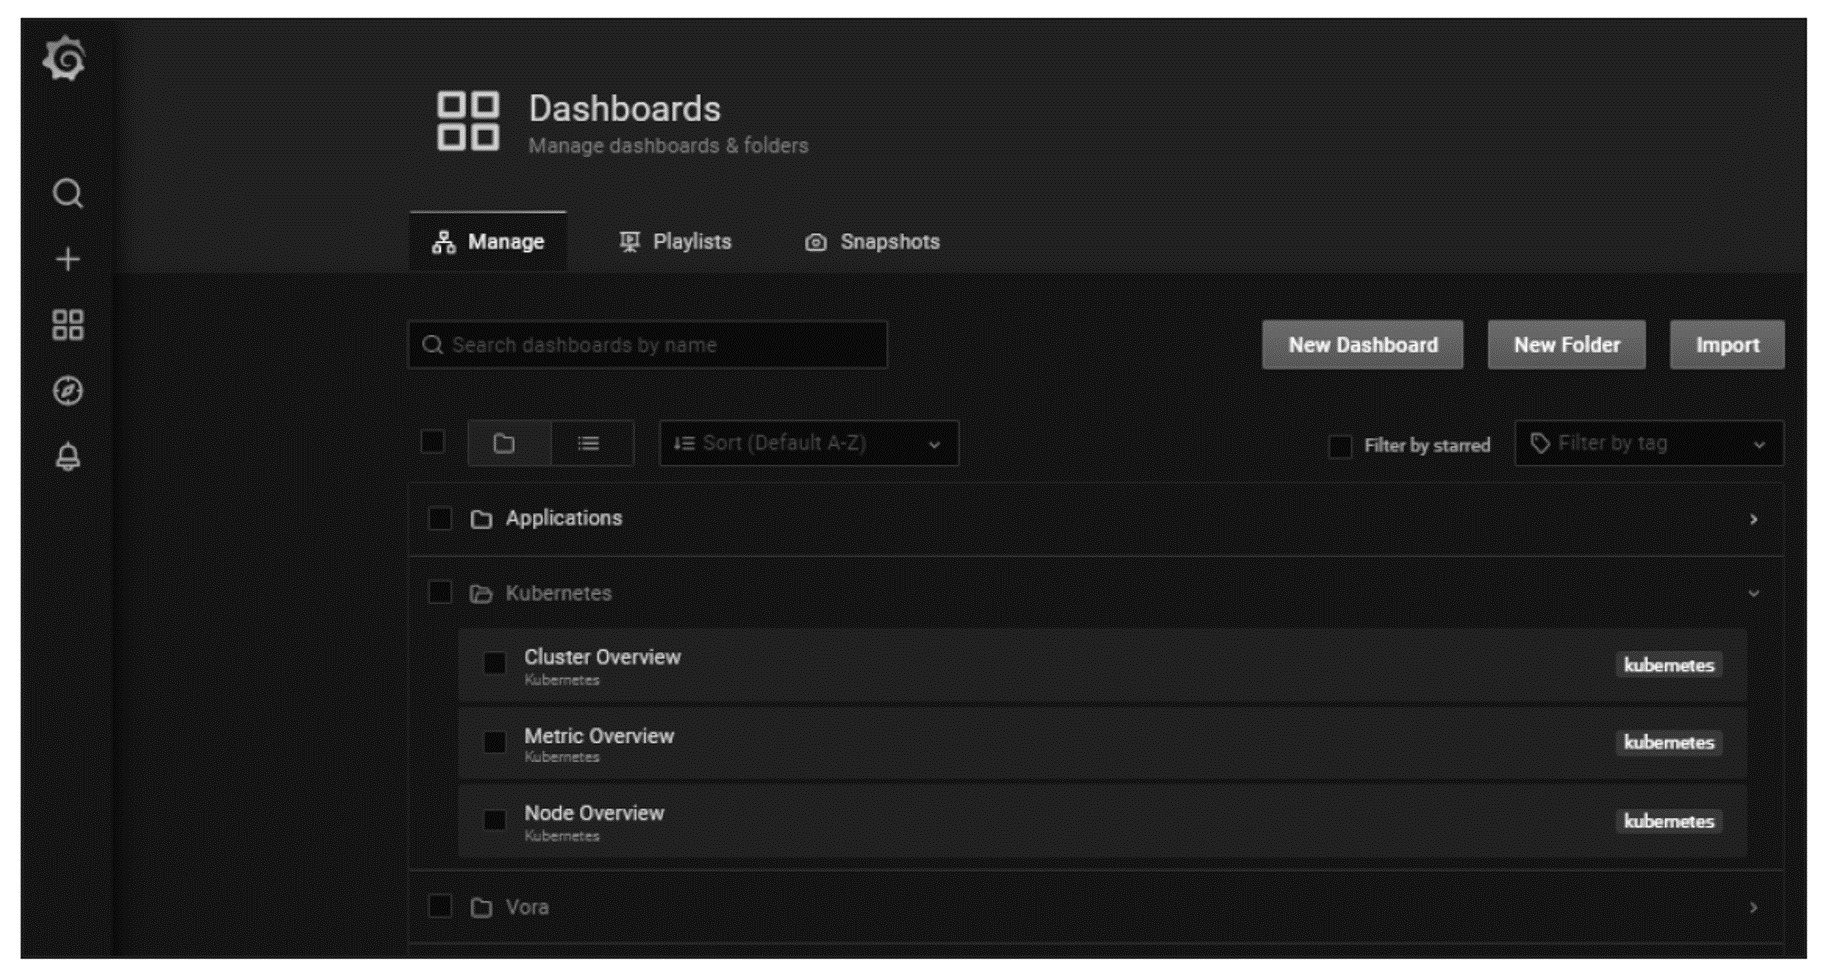
Three types of standard dashboards are available:
Cluster Overview
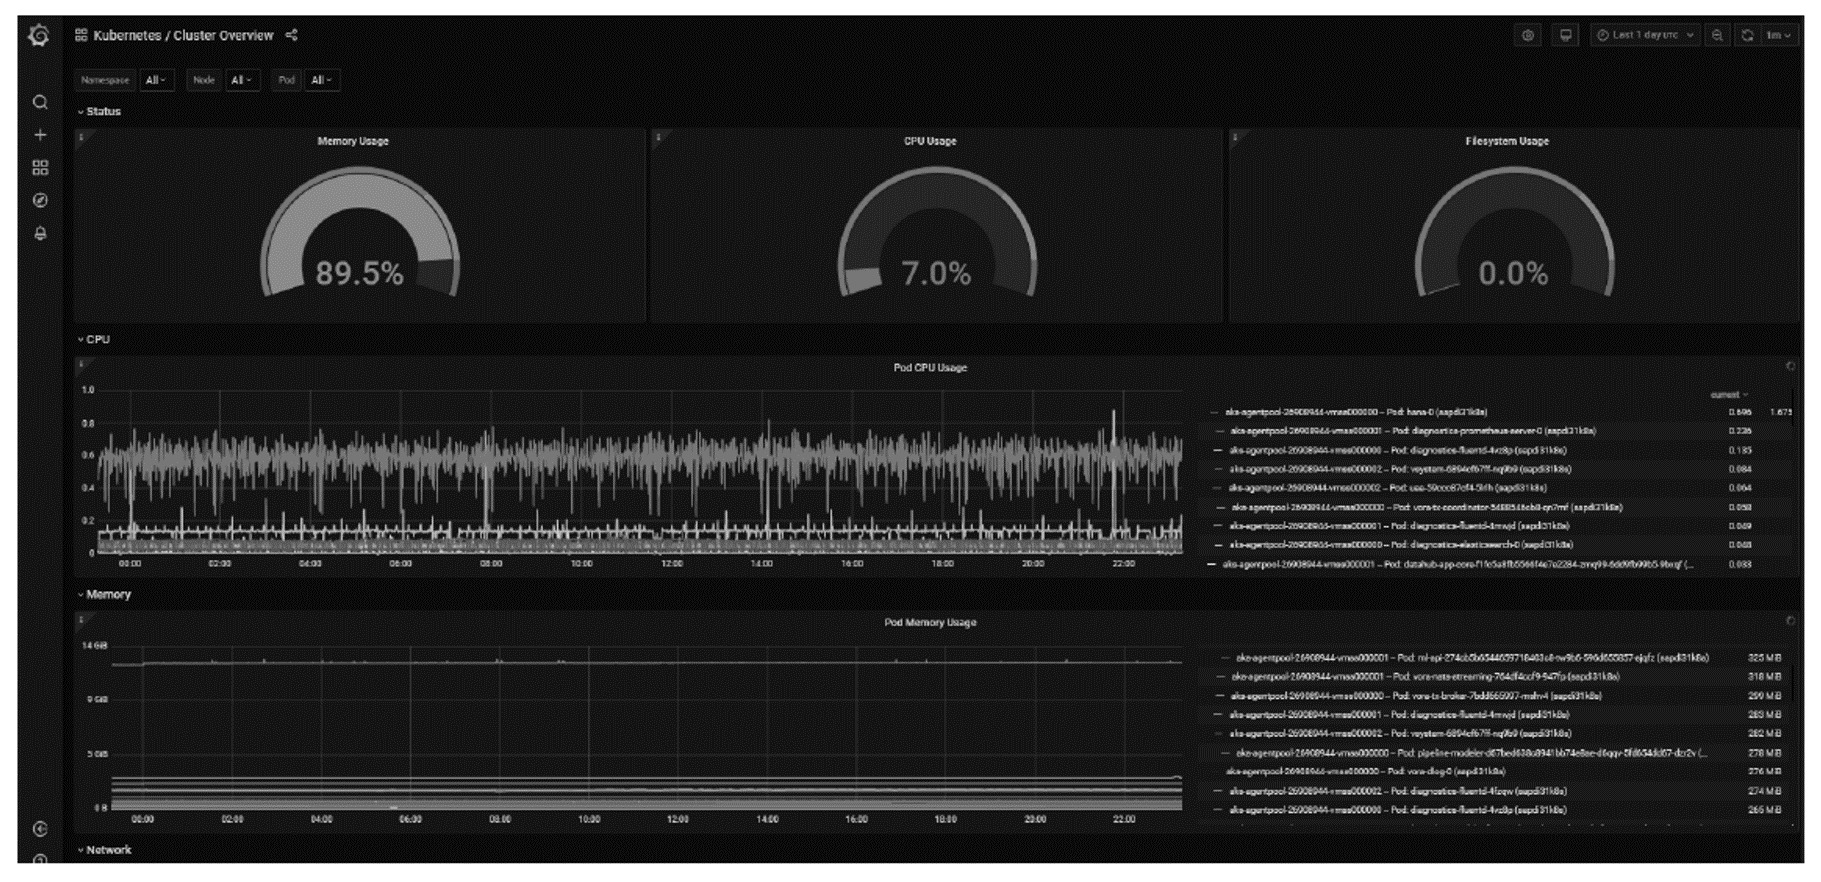
This dashboard provides an overview of the Kubernetes cluster from a usage point of view (i.e., CPU, memory, network, and file system usage). You can filter the data on the dashboard for more granular and individual node and pod perspectives. Below shows a sample Cluster Overview dashboard.
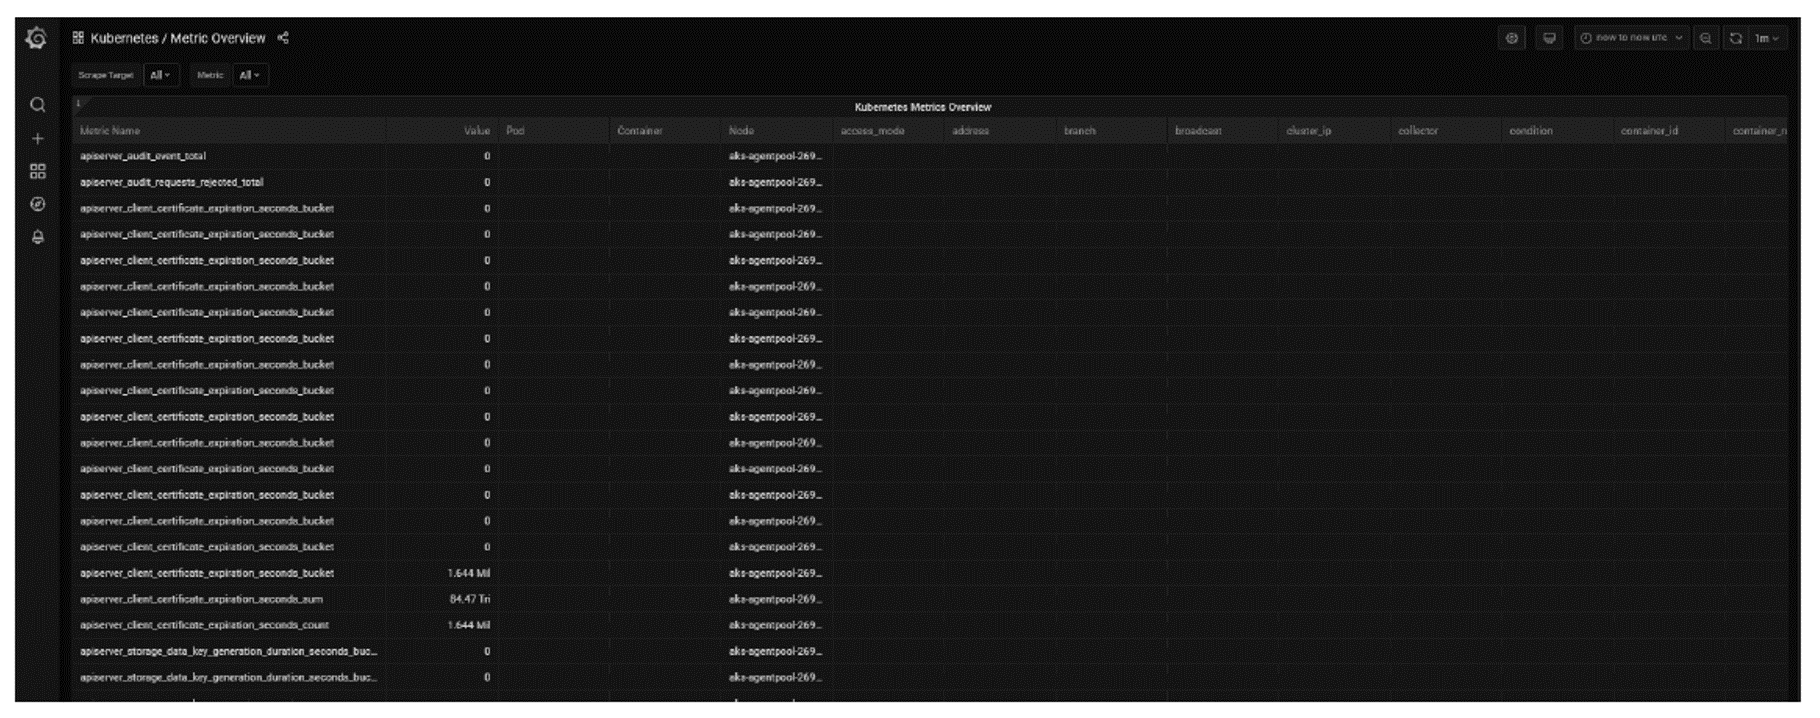
Metric Overview
This dashboard is a tabular format visualization providing the details about Kubernetes metrics, as shown in the next figure. You can filter this data for analyzing individual metrics.
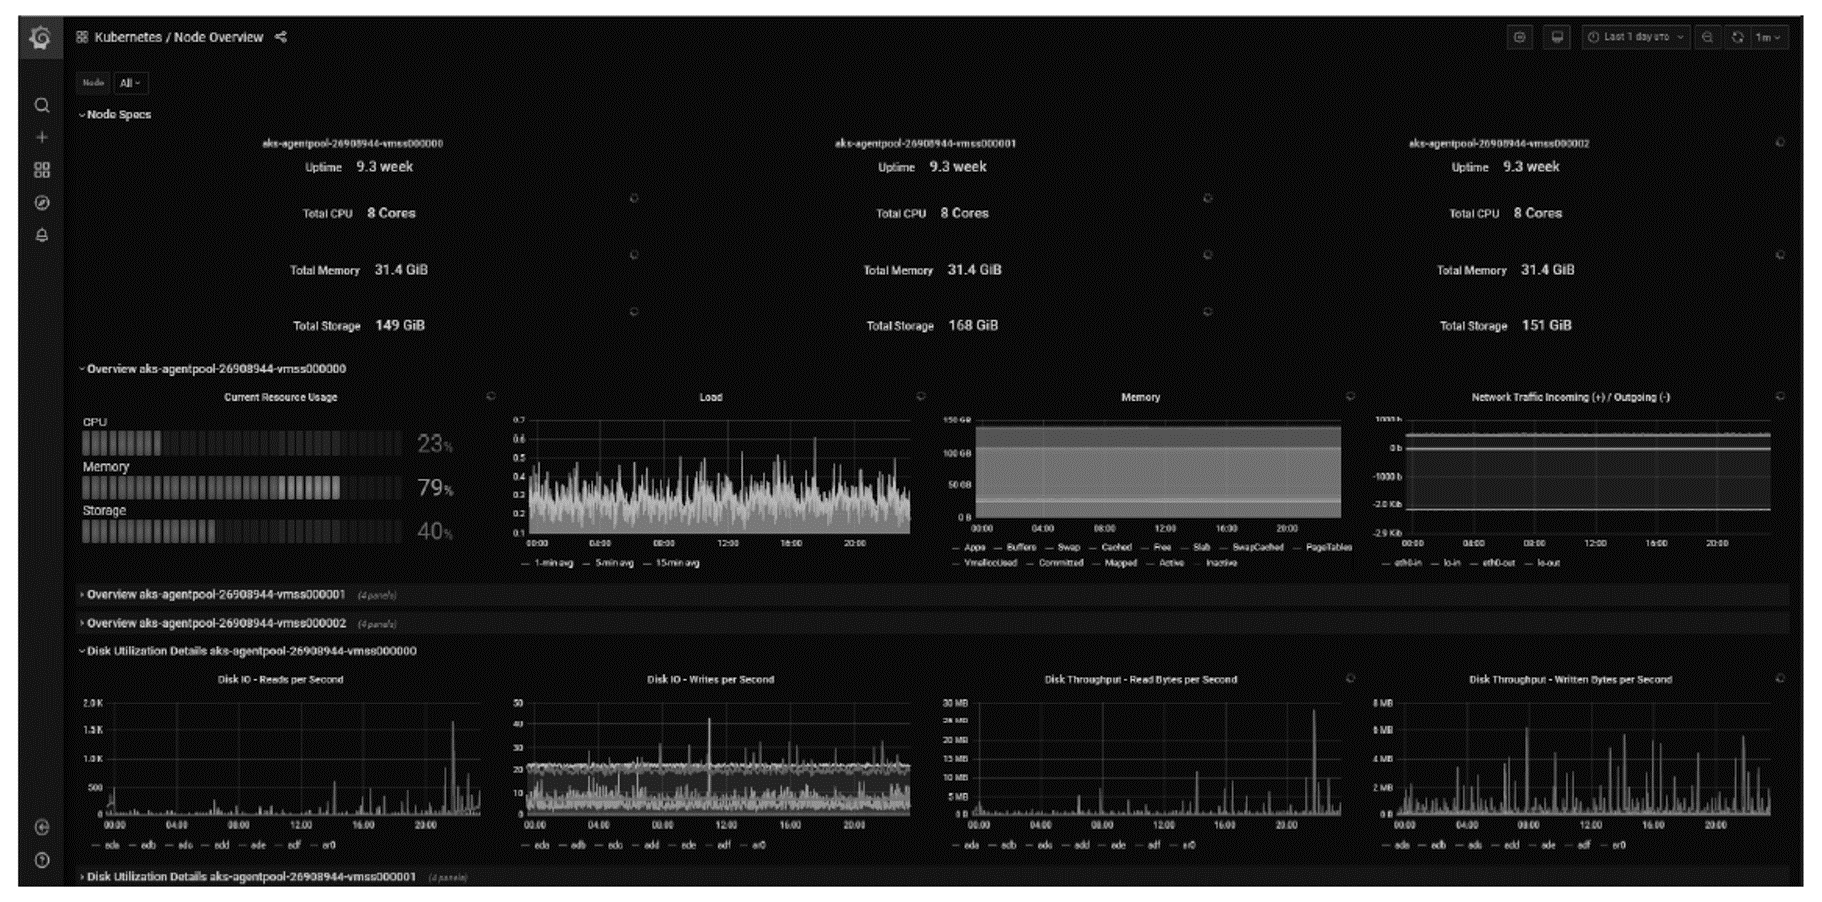
Node Overview
This dashboard provides details about each or all nodes in a Kubernetes cluster in a single place. You can find the visualized details about CPU, memory, storage, and network traffic of the node. You’ll also see details about disk utilization like I/O and throughput in line chart format. Below shows a Node Overview dashboard of a Kubernetes cluster that has three nodes.
17
You can create your own custom dashboards or modify existing dashboards in edit mode. All these dashboards can be exported and imported in JSON format.
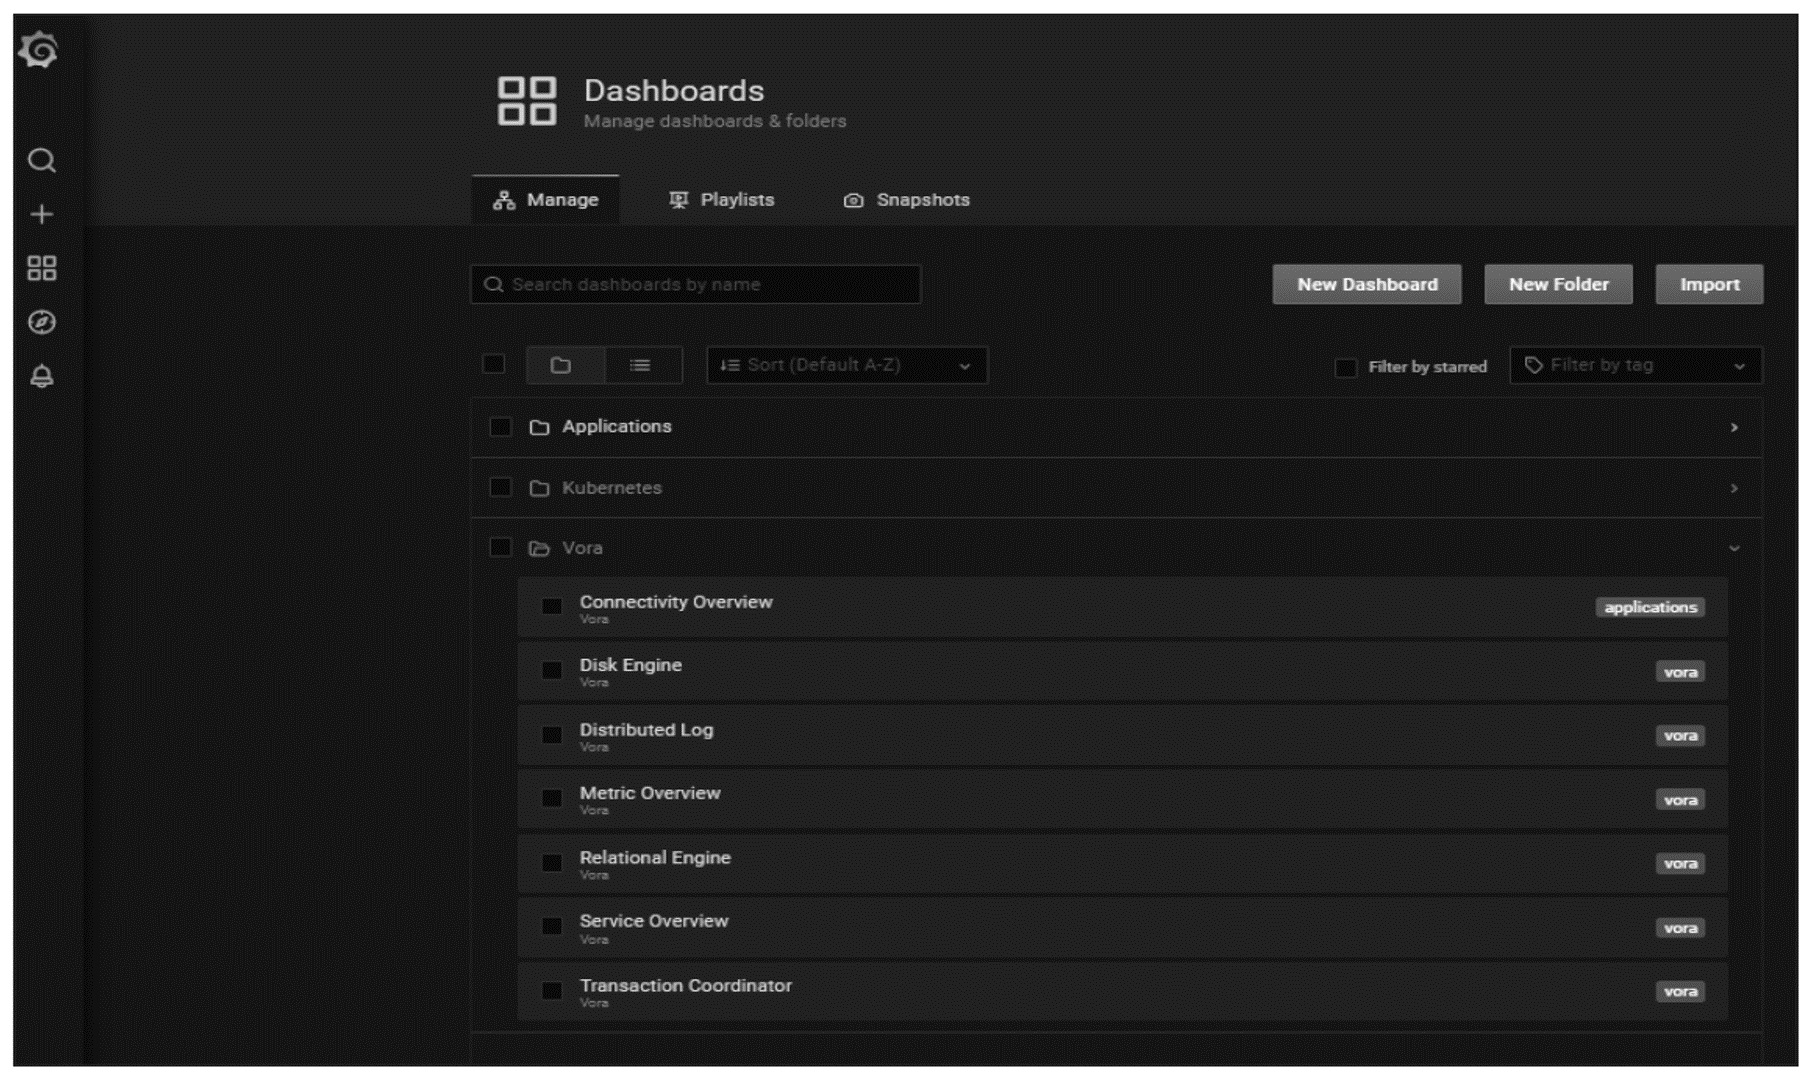
As with Kubernetes, SAP Vora also has its own standard dashboard in Diagnostics Grafana, which is available under the Vora folder and marked with the Vora tag, as shown below.
Integrating Diagnostics with External APM Solution
Application performance management (APM) is used to monitor the performance and availability of systems. To maintain a good level of system availability and performance, APM helps you detect and diagnose complex performance problems from system diagnostic metrics. APM transforms complex IT metrics into a business-understandable format.
SAP Data Intelligence can be deployed as a single instance deployment with multiple tenants in a single namespace of a Kubernetes cluster, and built-in SAP Data Intelligence diagnostics are generally enough to monitor the performance of the system through the Diagnostics Grafana web interface. The APM solution is required when SAP Data Intelligence has multiple deployments in different Kubernetes clusters. A central APM solution is required for system operations to monitor multiple SAP Data Intelligence instances and the Kubernetes clusters on top of which all these deployments run. SAP Data Intelligence has no built-in APM solution. Instead, SAP Data Intelligence diagnostics provide an interface to integrate with external APM solutions through which APM can retrieve system metrics data for monitoring performance.
SAP Data Intelligence diagnostics stores its data in Prometheus, which has three ways to expose data to an external APM solution:
REST API
In this option, system metrics data stored in Prometheus can be retrieved through a REST API or HTTP API endpoint (under /api/v1 on a Prometheus server). The expected API response format is JSON. APM can query different types of API endpoints to fetch data from a Prometheus server.
Prometheus Federation
This option allows a Prometheus server to scrape data from another Prometheus server. Based on use case, this option has two types: hierarchical or cross-service. The hierarchical approach is suitable for SAP Data Intelligence. In the case of multiple deployments of SAP Data Intelligence, a central Prometheus server can store metrics data hierarchically, from different Prometheus instances connected to various SAP Data Intelligence deployments, via federation.
Third-Party Integration
Prometheus can be integrated with various third-party tool based on specific requirements. File service discovery tools, like kuma, netbox, and scaleway, provide interfaces to integrate with Prometheus. Remote read and write features allow Prometheus to integrate with well-known tools like Microsoft Azure Data Explorer, Amazon Web Services (AWS) Timestream, Google BigQuery, InfluxDB, and many more. The alert manager Webhook receiver allows for integration with Amazon Simple Notification Service (Amazon SNS), Canopis, Gitlab, JIR Alert, and more.
For more information on third-party integration, refer to https://prometheus.io/docs/operating/integrations.
Editor’s note: This post has been adapted from a section of the book SAP Data Intelligence
The Comprehensive Guide by Dharma Teja Atluri, Devraj Bardhan, Santanu Ghosh, Snehasish Ghosh, and Arindom Saha.


Comments