
In this blog post, we’ll present an end-to-end implementation method for predictive analytics in SAP Analytics Cloud.
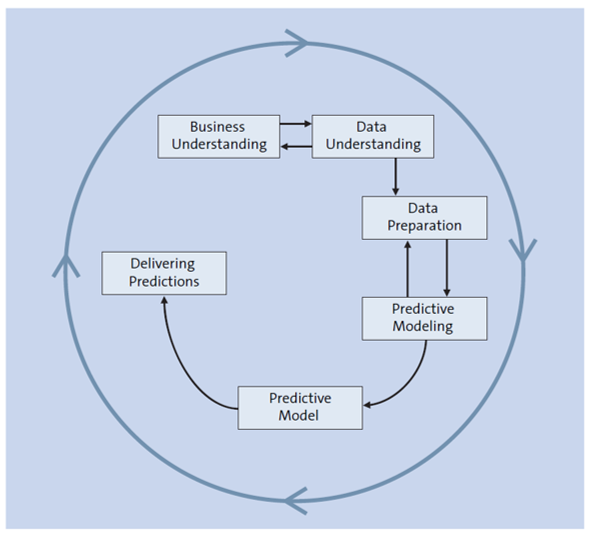
The most recognized method to implement predictive analytics projects is the cross-industry standard process for data mining, also known as CRISP-DM. You can read more about this method at http://s-prs.co/v577109. This process consists of six major phases as described in the figure below:
- Business understanding: During the first phase, the business requirements and the business success criteria will be identified and assessed. The business requirements will be translated into a predictive analytics question, with corresponding goals and success criteria. A project plan will be created.
- Data understanding: In the second phase, the available data sources will be reviewed, and data will be analyzed in detail to understand what it corresponds to and whether it’s usable as such in the context of the ongoing project.
- Data preparation: The third phase focuses on sourcing, cleansing, and formatting/integrating the data where required.
- Predictive modeling: This fourth phase consists of selecting the proper modeling techniques (e.g., classification, regression, or time series forecasting) and generating predictive scenarios and predictive models.
- Predictive model evaluation: In the fifth phase, predictive models are evaluated through analysis of training results and review of the overall process.
- Delivering predictions: In the sixth phase, the trained predictive models will be used productively by delivering predictions available to SAP Analytics Cloud users and potentially to other systems through data export.
In the next subsections, we’ll walk you through the step-by-step process and the detailed tasks required as part of each of the six project phases.
Business Understanding
The first phase of the predictive analytics project consists of determining the business expectations and the related implications; that is, what does the business owner want to accomplish? You need to spend the required time analyzing in depth the business objectives and what the business considers as project success criteria. This information will form the cornerstone of your project plan.
The business has high-level expectations that you must analyze and translate into a predictive analytics approach. Here are some examples of the high-level business requirements:
- Can we improve our planning accuracy? Can we do a better job in forecasting sales or expenses?
- Can we predict which employees might be leaving next year?
- Can we predict when customers will pay invoices?
The business objectives will be your North Star to propose a fit-for-purpose predictive analytics approach and a project plan to achieve these objectives on time. In certain cases, the business requirements can’t be addressed with predictive analytics, and you’ll have to make this clear from day one.
You should not rush or neglect the business understanding step. If you do, you might be wasting a great deal of time and effort producing the right answer to the wrong question.
You need to take time to fully assess the situation, and ask yourself and answer questions like these:
- What are the success criteria for the project? In business terms? In predictive analytics terms?
- What are the deliverables you want to aim for, such as data models, predictive models, stories, and so on?
- Which resources do you have at hand in terms of workforce (business and technical experts), available data, and available systems? For instance, you’ll need a running SAP Analytics Cloud system with enough licenses for both the project team but and your prediction consumers.
- What are the timeline constraints to deliver the project? Can these timelines be met knowing the project resources and constraints?
- What are the data platforms you can rely on? Where is the relevant data currently stored? Will the data be replicated into SAP Analytics Cloud, and, if yes, how? Do you have the proper rights granted to access the data? Will the data be easily available?
- Which kind of predictions are expected to be delivered? How will the predictions be consumed? Is prediction automation required?
- Are there any risks you can identify at the initial stages, and how can you mitigate them?
You must uncover any crucial factors at the beginning of the project that can influence the outcome of the project to avoid losing time and energy during subsequent steps.
Based on the collected information, you can determine the predictive analytics goals. Whereas business goals state the project objectives from a business perspective, you also need to refine these business goals into more technical goals. These predictive goals will also need to come with success criteria. As an example, the success criteria for a forecasting project might consist of dividing the current forecasting error by a factor of two.
Finally, you must produce a project plan that recaps the business goals as well as the predictive analytics goals. This plan should describe all the steps you’ll take to achieve the project.
Data Understanding
Let’s move on to our next phase. During the data understanding phase, you’ll proceed through the following steps, which we’ll discuss in the next sections:
- Collect the data.
- Describe the data.
- Explore the data.
- Check the data quality.
Data Collection
The data collection step consists of acquiring or accessing the data identified as part of the project plan. Depending on the data location, you might want to access and review the data either in SAP Analytics Cloud or directly in the data platform you’re relying on. One option consists of acquiring the data into SAP Analytics Cloud (or accessing it live if the data is stored in an on-premise SAP HANA system) and reviewing it there. While SAP Analytics Cloud can’t be considered an advanced data exploration and data quality solution, it provides some basic features that can help you during the data understanding phase.
On the other hand, most data platforms, such as SAP HANA, offer data exploration functionalities to help data engineers during the data understanding phase. Based on your project plan and initial assessment, multiple data sources might be required to serve your predictive analytics use case, and that you’ll need to group these. During this step, you also need to think of the target data model in SAP Analytics Cloud. Will you use datasets or planning models (only applicable to time series forecasting scenarios)? This modeling choice determines the possibilities you’ll have when using this data for predictive analytics and the way you’ll report on the predictions. It’s good practice to document your findings and choices in a data collection report.
The report should answer the following questions:
- Which data sources do you need to serve your predictive analytics use case?
- Where are these data sources located?
- Which method will you use to connect these data sources into SAP Analytics Cloud?
- Will you acquire the data into SAP Analytics Cloud and therefore replicate it from the original data sources? Or will you use the live connectivity mechanism to connect to on-premise SAP HANA tables and SQL views?
- Which problems have you identified at this stage? Which solutions have you found to mitigate these problems?
Data Description
In the data description step, you start digging deeper to examine the various properties of the data to answer the following questions:
- What is the data format?
- How many observations do you have in each data source?
- How many columns or variables do you have in each data source?
- What does each column correspond to? Can you name it?
- Should each column be considered a dimension or a measure?
- Did you discover anything specific about the data while describing it?
Based on this analysis, it’s recommended to create another short report that contains a description of the data and to document your findings. While this might sound tedious, it’s easy to lose track of the project context after a brief period.
Data Exploration
During the data exploration step, you’ll explore the data using queries and visualizations. Your analysis should answer the following questions:
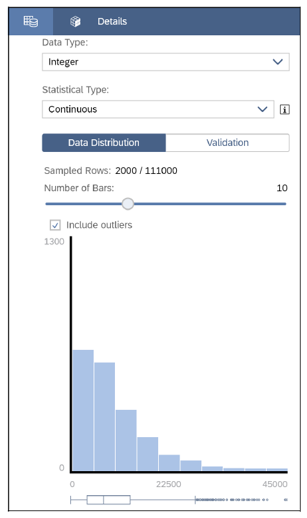
- How are your measures distributed?
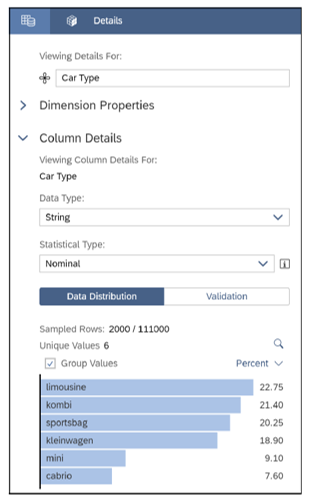
- What are the values in each of your dimensions?
Datasets in SAP Analytics Cloud offer basic data exploration features. For example, the first figure below shows the data distribution of a measure, and the second one shows unique values for a dimension.
Use your curiosity to dig deeper into the data, and you’ll likely make additional findings during this step. Similar to the previous steps, it’s recommended that you document your findings in a data exploration report.
Data Quality
In the data quality step, you should answer the following questions to check the data quality:
- Is the data complete? For example, in the context of a time series, you want to make sure the time series is as complete as possible and doesn’t contain too many value breaks in the course of the time series.
- Is the data correct, or does it contain errors? Can you spot any outliers in the data?
- Are there missing values in the data? Is it possible to fill these missing values with correct values or not?
The data quality step will result in you creating a data quality report, detailing your findings, and, if any data quality problems exist, listing practical solutions.
You should have a much deeper understanding of your data after this phase. This will help you prepare the data models best to serve your predictive analytics needs.
Data Preparation
There is a famous joke that says predictive analytics is 80% about preparing data and 20% complaining about preparing the data. While the reality might sometimes be less harsh, the condition of the prepared data does impact the accuracy of the predictive results. This is sometimes summarized by predictive analytics practitioners as “garbage in, garbage out.”
During the data preparation phase, you’ll follow these steps, which we’ll discuss in the next sections:
- Select the data.
- Clean the data.
- Enrich the data.
- Integrate the data.
Data Selection
The data selection step focuses on selecting the data used during the predictive modeling phase. The selection criteria should include the relevance to the predictive analytics goals, as well as quality and technical constraints such as limits on data volume or data types. As an example, if you want to forecast the next 12 months ahead for a given indicator, it’s ideal to select five or six years of the past evolution of this indicator, at the monthly level. Note that the data selection should consider dataset columns as well as observations. At the end of this step, you should be able to list the data you would keep or exclude and the rationale for these decisions.
Data Cleaning
During the data cleaning step, you’ll raise the level of data quality. There are many different actions you can take there. As we previously mentioned, if time series are incomplete, you should avoid as many breaks as possible in the time series by filling the intermediate, missing data points, assuming they correspond to null values. In addition, dimension members frequently have close names due to typos or incorrect master data management. You need to align these close values to the standard one. Note that smart predict can deal with missing values as part of the classification and regression modeling so you don’t need to fill in missing values artificially. The output of this step is a data cleaning report that lists the decisions and actions that were taken to address the data quality problems detected during the data quality check step of the data understanding phase.
Data Enrichment
The data enrichment step includes data preparation operations such as the production of derived variables or transformed values for existing variables. Derived variables are new variables that are built off one or more existing variables of the dataset. The calculation of derived variables and the transformation of existing variable values will need to be documented for traceability and further reference. Note that SAP Analytics Cloud does offer features to clean and enrich data in datasets and planning models.
Data Integration
In the data integration step, information from multiple data sources is combined to create new records or values. In most cases, the various data sources will be merged into one through joining. Merged data can also include ad hoc aggregations. SAP Analytics Cloud doesn’t offer specific features to handle data integration, so the data integration step must be handled outside of the solution, for instance, by using other SAP solutions such as SAP HANA, SAP Business Warehouse (SAP BW), or SAP Datasphere. Standard data types and data formats are natively handled by SAP Analytics Cloud.
At the end of the data preparation phase, you finalize your data models, alongside a description of the data preparation steps you took to create them.
Predictive Modeling
You’ve finalized your data models and are ready to use them to create your predictive scenarios and predictive models. The predictive modeling phase will consist of four major steps, which we’ll discuss in the following sections:
- Select the right predictive scenario type.
- Define a plan to evaluate and compare the predictive models.
- Create the predictive models.
- Assess the predictive models.
Select the Right Type of Predictive Scenario
The first step is to select the right predictive scenario type. In smart predict, you can create three types of predictive scenarios: classification, regression, and time series forecasting. While these three types cover a broad range of business questions addressable by predictive analytics, they don’t allow you to, for instance, answer clustering or product recommendation questions.
Here are the definitions of the three types of predictive scenarios:
- Classification: This type helps address “who” questions and associate a predicted probability to the corresponding event. Who could win the next game? Who might buy the next product this week? Who might leave the company this year?
- Regression: This type helps predict a numeric value, in the sense of “what” could be a value for a particular object of interest. What could be the sales price for a secondhand car? What could be the payment delay for an invoice?
- Time series forecasting: This type helps predict the evolution of a numeric value over time. What will revenue evolution be over the course of next year on a monthly basis?
Based on your earlier examination of the business question, you should already know at this stage which type of predictive scenario you’ll select.
Define a Plan to Evaluate and Compare the Predictive Models
Before you start creating the predictive models, you must define how you’ll assess the model accuracy and the relevance of the predictions to fit the business needs. In most cases, you can rely on the performance indicators that smart predict provides you with to evaluate the predictive models. These indicators are computed by internally reserving a set of the actual data and using the predictive model to predict this actual dataset. You might want to evaluate the performance of the predictive model in real-world conditions to estimate the potential performance you could get. For instance, it’s common for customers to evaluate the performance of the predictive model by predicting data for periods where they already know the actual values. Another common option is to let some time pass to gather more data points to compare the predictions to what happened later.
Create the Predictive Models
During this step, you first create a predictive scenario that will contain your different predictive models. You can create different predictive models on top of the prepared datasets or planning models. You’ll experiment with different predictive model settings. You’ll have to iterate between creating predictive models and sophisticating further the base data until you converge to acceptable predictive models. Once this is done, you need to carefully preserve the selected predictive models and their settings, and then describe the logic of your successful experiments. While smart predict stores every predictive model for you in a single predictive scenario, you need to create the right documentation because you might lose track of the predictive model creation history over time.
Assess the Predictive Models
Assessing the predictive models corresponds to confronting your domain knowledge, the predictive analytics success criteria you defined earlier, and your plan to compare and evaluate predictive model experiments. You must summarize the different results obtained, compare the respective qualities of the generated predictive models, and rank them in relation to each other. For this, you can use smart predict standard performance indicators; you can also use ad hoc performance indicators you create in stories.
Predictive Model Evaluation
In the predictive model evaluation, you’ll focus on three major steps, which we’ll discuss in the following sections:
- Evaluate your results.
- Review your process.
- Determine the next steps.
Evaluate Your Results
Evaluating your results and the performance of predictive models is typically done by the prediction creators using the following standard performance indicators provided by smart predict:
- Classification: Predictive power and prediction confidence.
- Regression: Root mean square error (RMSE) and prediction confidence.
- Time series forecasting: Expected mean absolute percentage error (MAPE), expected mean absolute error (MAE), expected mean absolute scaled error (MASE), expected root mean square error (RMSE), and expected coefficient of determination (R2).
The performance indicator you choose to evaluate the predictive models should be the one that most closely matches the business objectives defined at the beginning of the project. Customers often create their own performance indicators in the context of stories to evaluate the prediction performance. The rationale for doing this is to create a performance indicator that is close to the way the business expresses its needs and will also evaluate predictions. You can use your predictive model to deliver predictions and compare them to what will happen later if your time and budget constraints allow.
Despite all the excellent work that you’ve been doing through the previous phases, the performance of your predictive models may not be satisfactory enough. If this is the case, consider the following possibilities:
- Add more data: For classification and regression, if your predictive confidence indicator is too low, this is usually a sign that adding more observations is likely to improve the model. Similarly for time series forecasting, you need to have enough observations for proper evolution patterns to be detected.
- Create more variables: For classification, if your predictive power indicator is too low, this is usually a sign that adding more variables is likely to improve the accuracy of the classification model. For regression, if your RMSE indicator is too low, this is usually a sign that adding more variables is likely to improve the accuracy of the regression model. For time series forecasting, you might notice peaks and valleys in the residuals that could be better explained by additional influencers.
- Improve the data quality: Missing and outlier values in the source data can reduce the predictive model accuracy.
The output from this evaluation step is an assessment of the results with respect to the business goal and success criteria. You summarize the assessment results regarding the business success criteria and provide a final statement as to whether the predictive analytics project meets the initial business objectives.
Review Your Process
You need to conduct a thorough review of the predictive analytics project to determine if there is any crucial factor or task that has somehow been overlooked. Summarize the process and highlight activities that have been missed and/or should be repeated. This review also covers quality assurance issues, so, for example, consider these questions: Did you correctly build the predictive model? Did you only use variables that are allowed for use and that are available for future analysis? This step is needed to build additional confidence and trust in the steps you took.
Determine Your Next Steps
Finally, you’ll need to determine the next steps according to the results assessment and the process review. You’ll need to decide whether to finish the predictive part of the project and move onto deployment, if that is appropriate, or whether you need to initiate further iterations and set up additional tasks. This step includes the analysis of the remaining resources and budget that influence the decisions. You’ll need to describe the decisions about how to proceed, along with the rationale.
Additional Predictive Features in SAP Analytics Cloud
Been itching to unlock the power of predictive analytics in SAP Analytics Cloud? Learn how Smart Discovery, Search to Insight, and Data Change Insights can help you forecast trends, uncover hidden patterns, and transform your data into actionable insights.
In addition to the classic BI functionalities, SAP Analytics Cloud offers so-called predictive analytics functions, which enable you to proactively identify problems and opportunities instead of just reacting to them. In essence, they help you predict the future. Various APIs are also provided in stories for these functions, which we’ll take a closer look at now.
Smart Discovery
Let’s start with the smart discovery function, which uses machine learning to analyze your data and help you put your data into a specific context, discover new data, or find previously undetected relationships among your data. We’ll cover smart discovery-related APIs in the following sections.
SmartDiscovery
The SmartDiscovery API consists of two different methods:
- buildStory
- generateUrlToBuildStory
With the buildStory method, you have the option of creating a smart discovery URL that you can provide as a hyperlink in a dialog. An end user can then click that hyperlink to open the smart discovery story in a new browser window.
Availability on Mobile Devices: The smart discovery function is not available if you open it via a mobile device or a publication.
Another method of this API is the generateUrlToBuildStory method, which you can use to create a smart discovery URL. It doesn’t open a dialog, but you can use the URL as a hyperlink on images or buttons, for example.
SmartDiscoveryDimesionSettings and SmartDiscoveryStructureSettings
The SmartDiscoveryDimesionSettings and SmartDiscoveryStructureSettings APIs contain various methods that you can use to create the dimensions and structure settings for a smart discovery. You can copy dimension filters of a dimension into your page filter and set various properties, and you can also show and hide the properties panel.
The code below shows how you can use these methods. For example, you can place the following code on a button that is used to call the smart discovery function.
var ds = Chart_Forecast.getDataSource();
var members = ds.getMembers("Product_3e315003an");
var SDsetting = SmartDiscoveryDimensionSettings.create(ds, "Product_
3e315003an",[members[1]]);
SDsetting.
setIncludedDimensions(["Location_4nm2e04531", "Store_3z2g5g06m4"]);
SDsetting.setIncludedMeasures(["[Account_BestRunJ_sold].[parentId].&[
Gross_Margin]","[Account_BestRunJ_sold].[parentId].&[Discount]"]);
SmartDiscovery.buildStory(SDsetting);
When you execute this, a window (shown in the next figure) first opens in which you must confirm the start of smart discovery.

Once you’ve started smart discovery, a new tab will open and you’ll first be shown a loading animation.

Once the loading process has been completed, you can create your desired destinations and entities as well as advanced settings. This process will resemble the one depicted here.

Once you’ve made your settings, you can run your smart discovery function. You can see a possible result below.

Search to Insight
The search to insight function of SAP Analytics Cloud offers an interface in which you can query data using natural language. It lets you ask questions, get your answers from the data models, and start a new story.
Here, you can ask questions like these (depending on your data):
- How high was the turnover for Germany?
- Which item was sold most frequently in 2021?
Supported Languages: The search to insight function is currently only usable with English words. The SearchToInsight API allows you to open and close the search to insight dialog. You can also insert your search to insight results into a chart or work with variables.
Availability on Mobile Devices: The search to insight dialog is currently not supported for mobile devices.
Data Change Insights
With the data change insights function, you can create snapshots of your data to compare them with one another. You can send these results by email or an app notification.
The API provides you with various methods for comparing the current status of the application with a snapshot or two snapshots. You can also save a snapshot or open the subscription dialog.
Delivering Predictions
Predictions can be used in different ways in SAP Analytics Cloud. The main goal is to provide predictions to prediction consumers so that they can use them in their business context and make decisions based on these predictions. Predictions can be both integrated into stories and exported to external systems, which we’ll discuss next.
Integrating Predictions into Stories
The most straightforward place to consume predictions is the stories. Predictions can be exported into datasets (using any predictive scenario type) or planning model versions (specifically using time series forecasting). Stories can be built by story designers off datasets or planning model versions. At the end of the day, prediction consumers can see actuals and predictions side by side in stories, if not budget and forecast in the context of financial planning. They can make decisions based on present and future information. As we previously mentioned, prediction consumers aren’t experts in predictive analytics, but they know their business intimately. It’s key that prediction creators and story designers can deliver the predictions with enough business context and in a straightforward way so that prediction consumers can understand and use them easily. Smart predict provides several functionalities for prediction consumers to gain trust in the predictions.
Exporting Predictions outside of SAP Analytics Cloud
In some cases, it’s not enough to consume the predictions only in the context of SAP Analytics Cloud, so you’ll need to export predictions out of SAP Analytics Cloud.
Several features make prediction export possible, with different degrees of automation:
- You can export models’ transaction data to SAP Business Planning and Consolidation (SAP BPC), SAP S/4HANA, SAP Integrated Business Planning for Supply Chain (SAP IBP), or OData services. For SAP S/4HANA, you can set up a schedule so that exports recur automatically on a daily, weekly, or monthly basis. This type of export is applicable to time series forecasting only. You can see more information here: http://s-prs.co/v577111.
- You can export model data using the Data Export Service application programming interface (API). This type of export is applicable to time series forecasting only. You can find more information here: http://s-prs.co/v577112.
- You can export table data as a comma-separated values (CSV) or Microsoft Excel (XLSX) file. Story tables can contain predictions originating from any predictive scenario. You can read more here: http://s-prs.co/v577113.
- You can export chart data as a CSV file. Charts can contain predictions originating from any predictive scenario. You can read more here: http://s-prs.co/v577114.
Learn SAP Analytics Cloud in Our Rheinwerk Course!
Master SAP Analytics Cloud! Learn how to connect and model data, create visualizations, work with planning models, and use predictive analytics. This five-day course provides a comprehensive introduction to the core capabilities of SAP Analytics Cloud and its all-in-one BI functionality. Get access to course recordings by clicking the banner below.

Editor’s note: This post has been adapted from a sections of the books SAP Analytics Cloud: Predictive Analytics by Antoine Chabert and David Serre and Application Development with SAP Analytics Cloud by Josef Hampp and Jan Lang. Antoine is a product manager for SAP Analytics Cloud. He joined SAP more than 16 years ago and developed his expertise in SAP Analytics products. David is the product owner of the smart predict capability in SAP Analytics Cloud. He works closely with the product management team to convert customer needs into the features delivered in smart predict. Josef has worked with analytics and application development at SAP Deutschland SE & Co. KG since 2017. Following his move to customer advisory, he has been working more intensively on the topics of data and analytics. Jan is a leading expert for data management and reporting at FC Bayern Munich. He has been working with SAP Analytics Cloud since 2017. He supports customers of the FC Bayern digital and media labs with his expertise in SAP Analytics Cloud and SAP Datasphere.
This post was originally published 4/2024 and updated 8/2025.


Comments