
In this blog post, we’ll discuss all the jargon used in the Scrum framework. In addition to the expertise, you need the vocabulary to have a successful SAP Activate project.
Sprint
A sprint is a time-boxed period between two and four weeks when the Scrum team resolves the business problem by providing a working software.
Burn-Down Chart
The purpose of a burn-down chart is to show the amount of work remaining as the development team moves forward into the project. The chart can show a specific sprint or the complete product backlog. The x-axis of the chart shows the time, in days or weeks, while the y-axis shows the amount of work remaining in story points—a relative unit to estimate a user story—or in task hours. As the name suggests, the remaining hours or story points will continue to go down while the development team completes the assigned functionalities. The left-hand side of the figure below shows a sample burn-down chart.
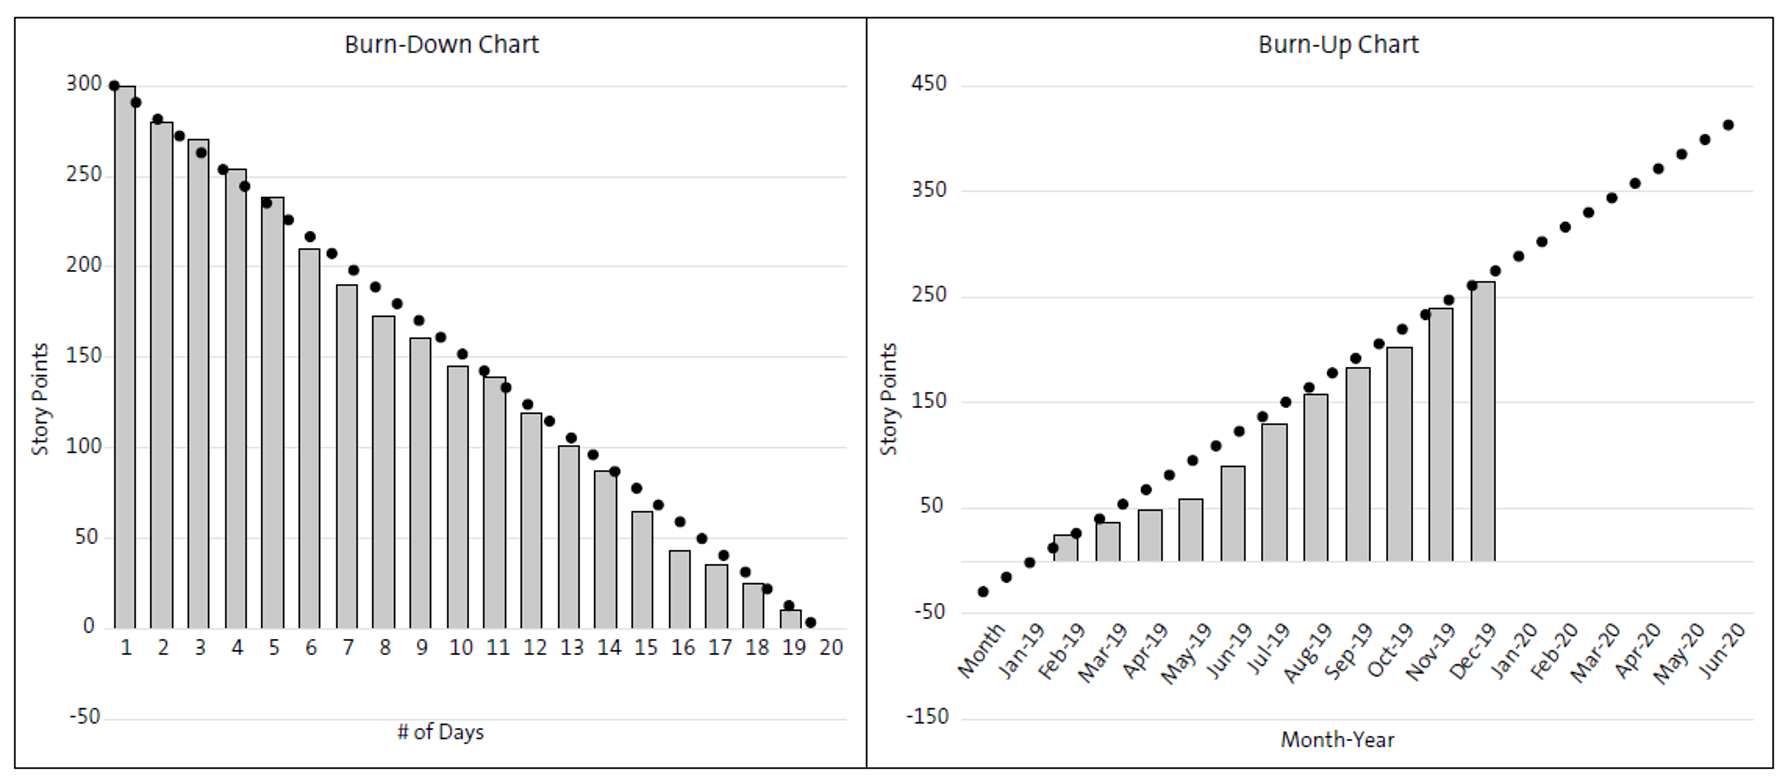
If you show the work completed instead of the remaining work on the y-axis as shown in the right-hand side, then the chart becomes a burn-up chart where the graph is gradually moving upward, indicating the progress in the project as it shows the cumulative work done.
Epic
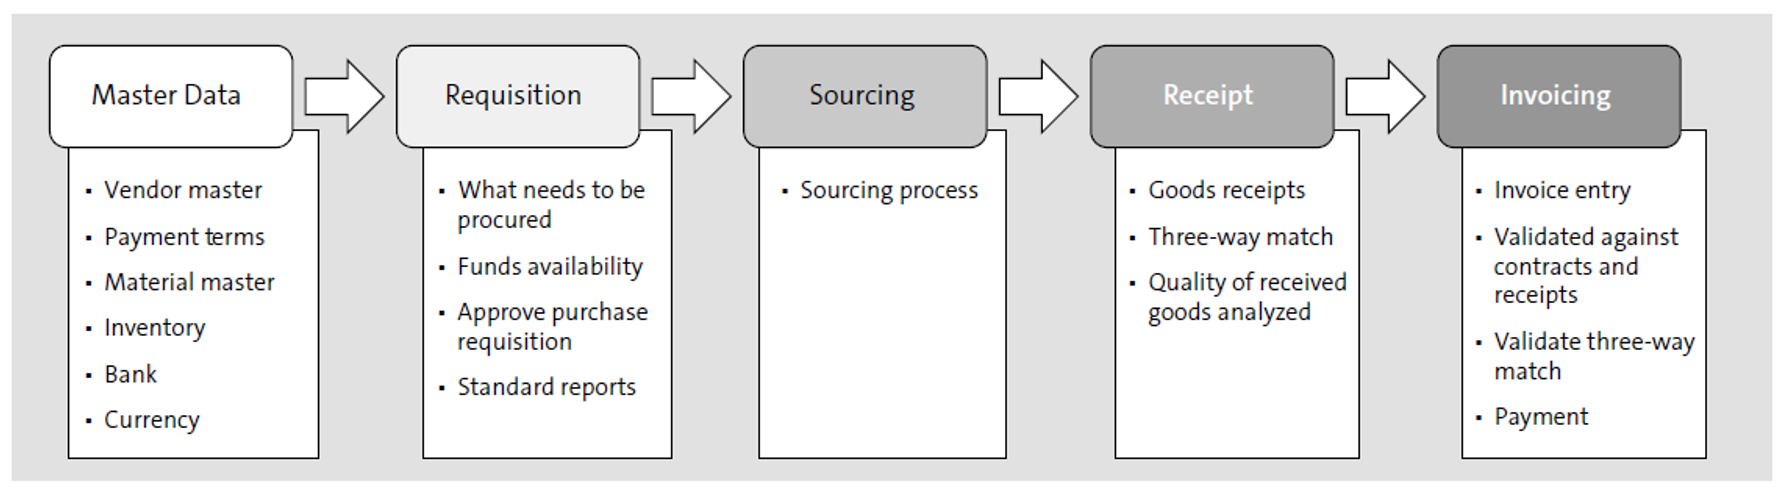
An epic is a large user story that spans multiple sprints. Epics can also span multiple Scrum teams. An epic is a high-level requirement either coming from the client or arising due to system requirements. In the next figure, master data, requisition, sourcing, receipt, and payment are epics while the other items mentioned under each block are user stories, which we’ll discuss next. An epic, for example, invoicing, will span multiple sprints and different development teams. However, a user story, such as a vendor master, must be completed in a sprint.
User Story
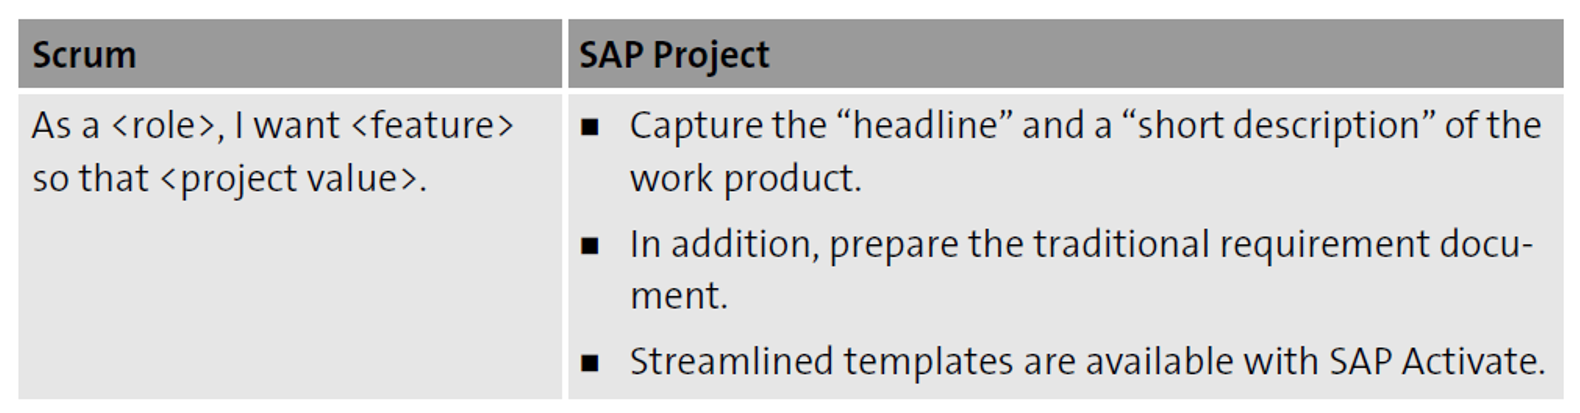
A user story is a high-level requirement with sufficient information that the development team can use to estimate the work product. Per Scrum, the user story has three components: a role, a feature, and a benefit. However, in SAP, we use a slightly different version of the user story, as shown in this table.
Product Backlog
A product backlog is a list of requirements, also known as user stories, arranged in a specific order to enhance the value of the delivered product that needs to work upon to create or maintain the product. The product backlog should be managed by the product owner. There can be only one product backlog for a product.
Sprint Backlog
A sprint backlog consists of the product backlog items for the given sprint along with a plan detailing the delivery of the increment—a functional software product—and the realization of the sprint goal. It’s an output of the sprint planning meeting. The process to create the sprint backlog requires close coordination between the development team and the product owner.
Story Mapping
Story mapping is a key step in identifying the complete requirements or gaps in user stories. The map captures the activities and tasks that a user performs during a specific process. Let’s take a deeper look into the story mapping by analyzing this figure.
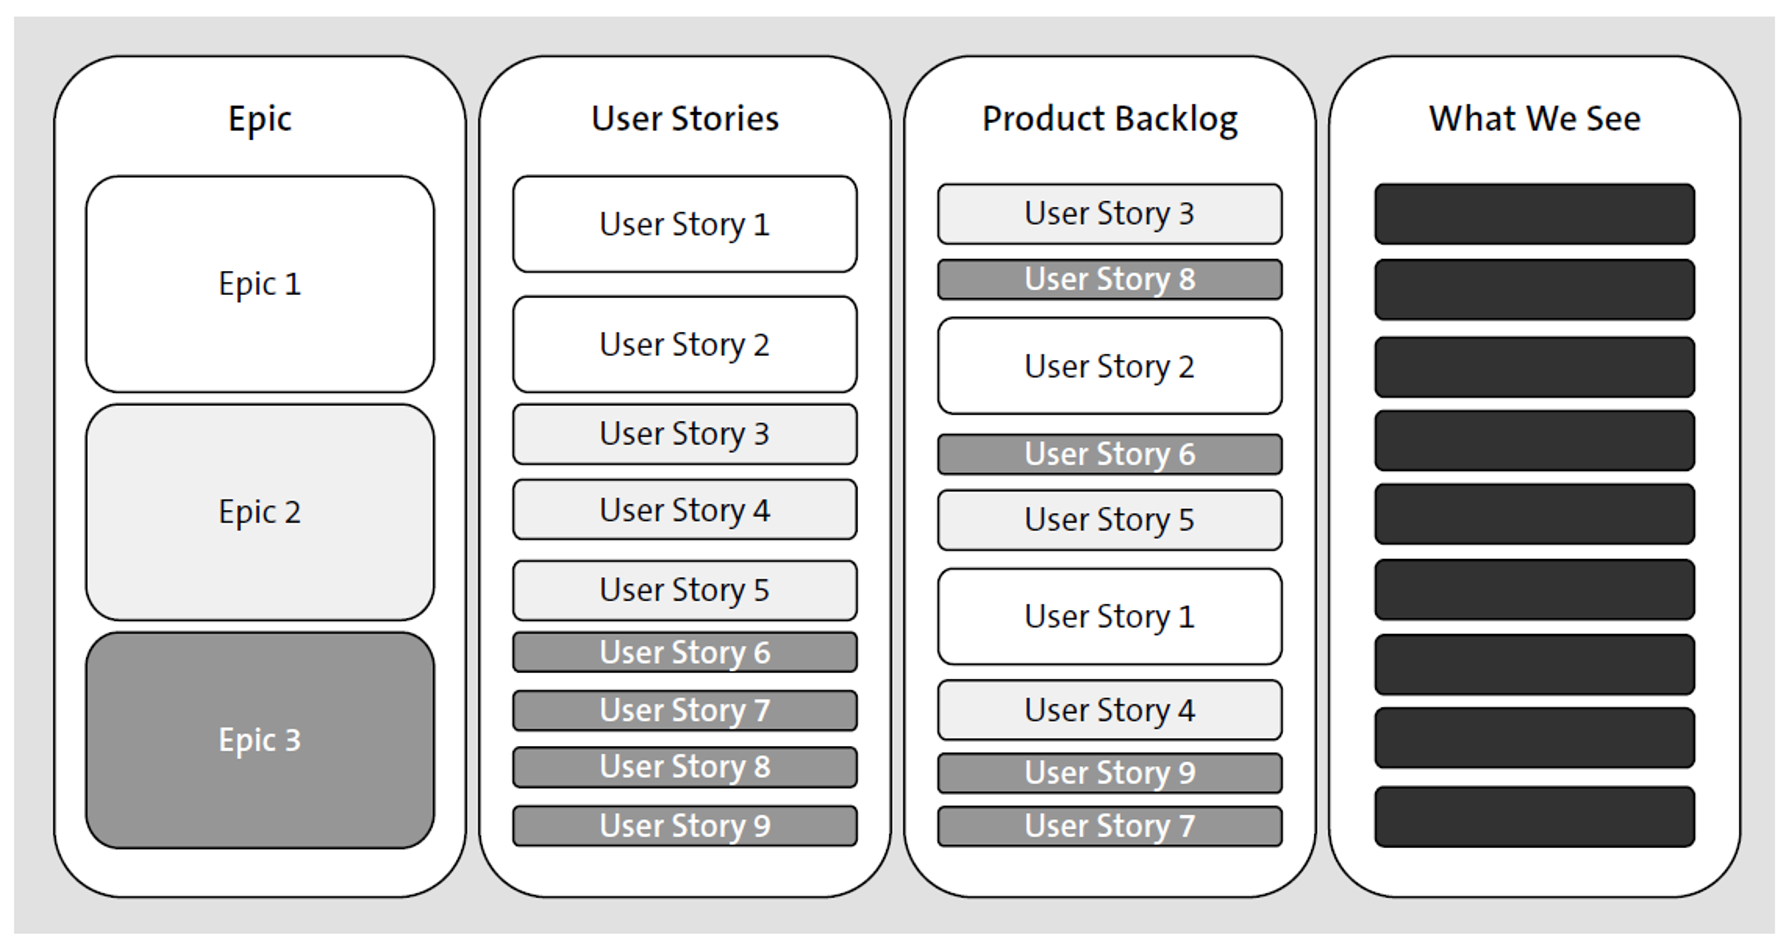
Each epic is broken down into user stories and then moved to the product backlog. The product owner prioritizes these user stories based on the value that they will add to the product. However, the challenge is that most of the Scrum team, except the product owner, may not able to tie these stories back to the original epic or relate them to each other. For example, two consecutive user stories in a product backlog may be related to the user role and privilege, as well as the posting of an invoice; remember that the user stories are ordered based on the value. It becomes very difficult to identify any business gaps, and the Scrum team loses the business context of the user story.
There are several ways to mitigate this issue, but the most common way is to use a subject matter expert (SME) who will tell the complete process as a story, identifying each activity and task. The development team, as they hear the keywords such as task or activity, note down those tasks on a post-it. At the end, the team arranges those tasks in a horizontal way in left to right order. More than one option of a task arranged in a column identifies parallel or optional activities. The best way to identify any gaps is to “reverse role play” where someone from the development team will explain the tasks to the SME as captured in the story map. The next figure shows a sample story map with a business gap in it.
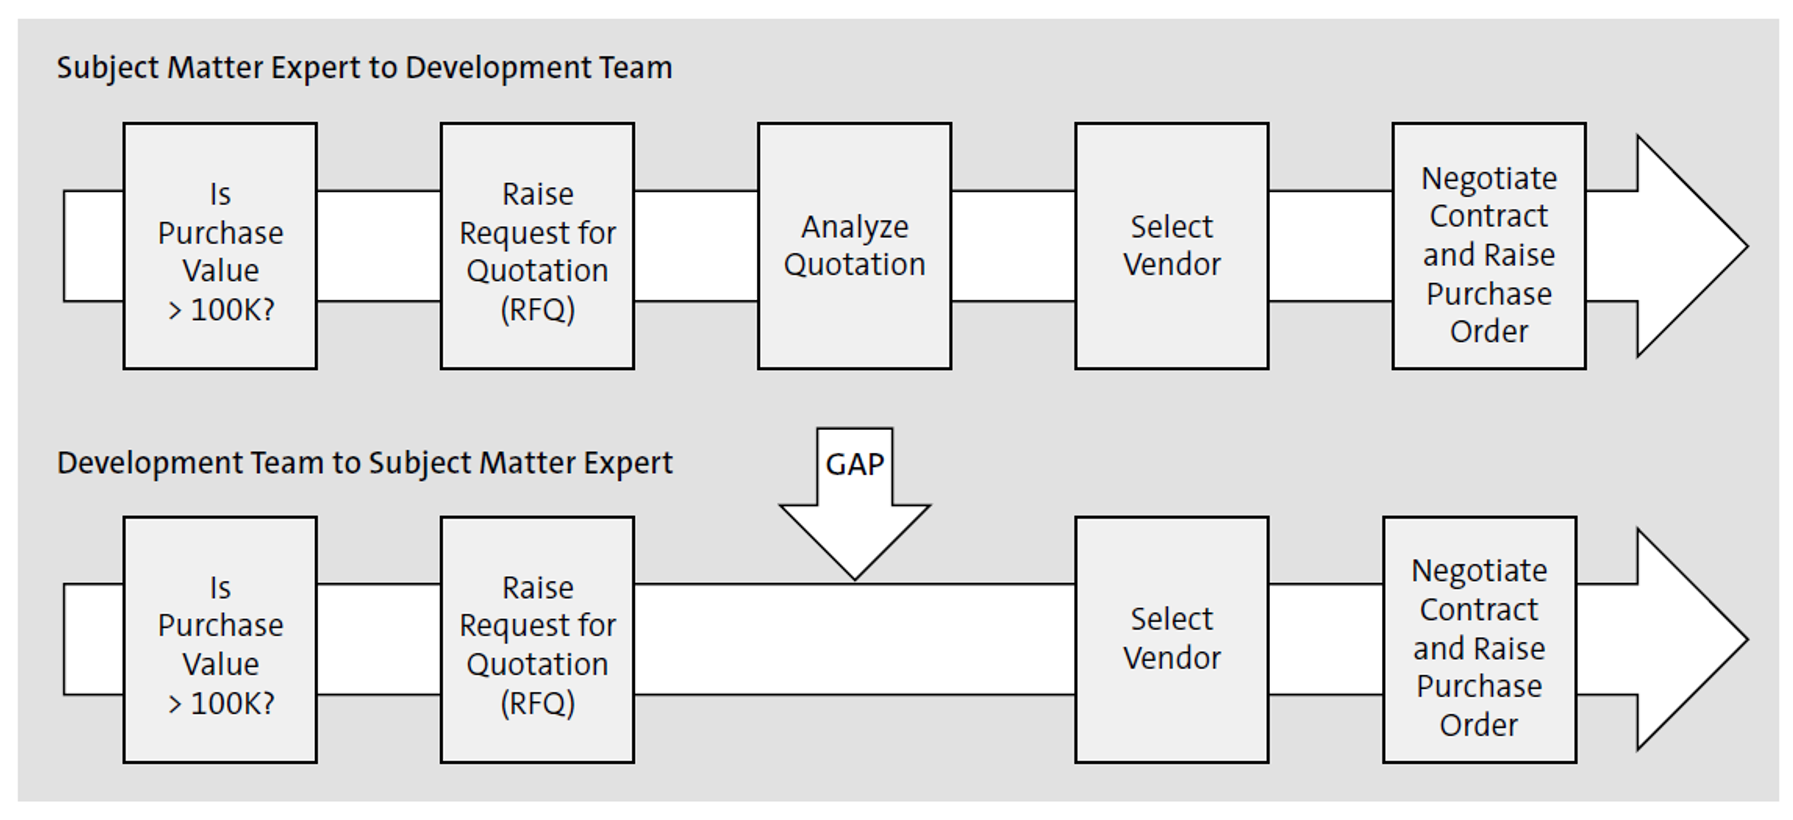
Once done, the team can prioritize the user stories and identify the iterations. It isn’t a one-time exercise, and the team has to keep it up to date.
Velocity
Velocity is a key metric that gives you the amount of work a team is doing or can do in a single sprint. As you complete more sprints, you can calculate the velocity by summing all the work done divided by the number of sprints. If you look at the burn-up chart from earlier, note that the team completed 25 story points in February, 12 in March, 11 in April, and 10 in May. The formula to calculate the velocity is:
Velocity = (25 + 12 + 11 + 10) / 4 = 14.5 Story points
However, for the complete project, the velocity was 23.5 story points.
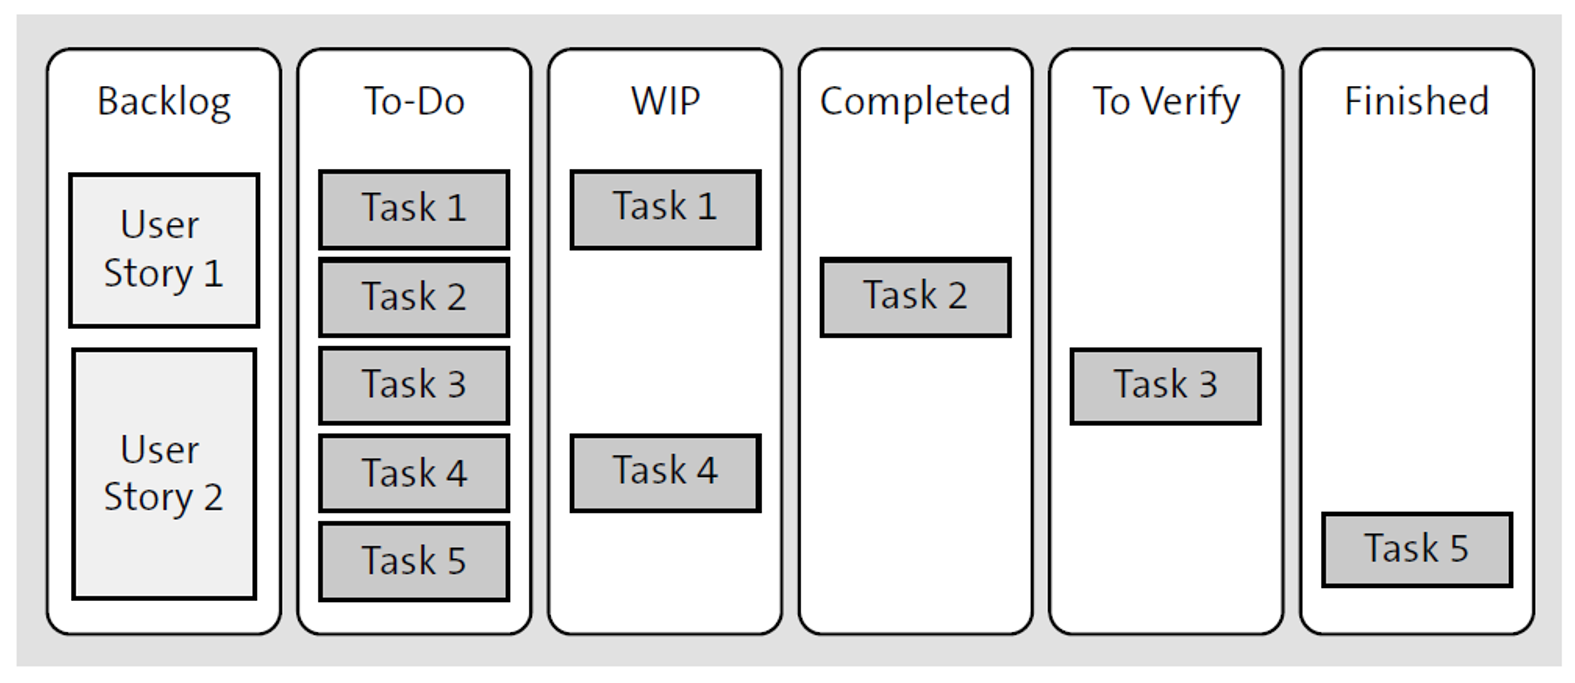
Scrum Board
How will you know about the status of each user stories while in a sprint? The Scrum board, as shown in the final figure, is a tool that helps the team track the progress of each user story. The team updates the board on a regular basis and shows all the items that are required to be completed in the sprint.
Explore five golden rules for implementing SAP S/4HANA with SAP Activate here.
Learn SAP Activate in Our Upcoming Rheinwerk Course!
Jump-start your SAP S/4HANA project with SAP Activate! This course covers essential concepts for running on-premise, private, and public cloud SAP S/4HANA projects. Explore the tools, transition paths, and timelines for this methodology—and learn to dodge common project pitfalls with guidance from an expert! Click on the banner below to learn more and order your ticket.

Editor’s note: This post has been adapted from a section of the book SAP Activate Project Management Certification Guide: Certified Associate Exam by Aditya Lal and Jeyaganesh Viswanathan. Aditya is an SAP practice and transformation director with more than 24 years of experience in large and complex project management spanning across geographies, domains, and business units. He has extensive experience in managing global implementations of SAP ERP 6.0, and for the last few years, he has focused on the implementation of SAP S/4HANA. Jeyaganesh is an IT lead at Zoetis, located in Parsippany-Troy Hills, NJ. He has published research papers in reputed international journals, which are also available online. His main research focus is on artificial intelligence (AI), robotic process automation (RPA), and enterprise resource planning (ERP) process automation. With more than 20 years of expertise in SAP solution design, implementation, support, and research, he has a proven track record in streamlining processes through deep integration across SAP ERP, SAP Manufacturing Integration and Intelligence, and industry solutions including high-tech and retail modules.
This post was originally published in 2/2022 and was updated in 3/2025.


Comments