
This blog post will educate you about basic ABAP debugging and smart form skills, which make SAP consultants more self-sufficient and independent. We will introduce both topics, highlight key techniques and features, and conclude with common use cases for both.
Debugging
The ABAP debugger is a programming tool provided by SAP to inspect ABAP code. With this tool, you can display data objects and check the flow logic of ABAP programs. In other words, you can perform step-by-step analysis and troubleshooting of any piece of ABAP code.
Techniques & Features
Below are common techniques and features of the ABAP debugger.
- Breakpoint: A signal in a specific line of the program source code. This signal indicates to the ABAP runtime processor to stop the program at the relevant line and start the ABAP debugger.
- F5 Key: Executes the program lines in a step-by-step manner.
- F6 Key: Executes the program block by block (example: methods, function modules, and subroutines) without going into individual code blocks.
- F7 Key: Executes all lines of code in the block together (example: methods, function module, and subroutines).
- F8 Key: Executes the entire program and comes out of the transaction (exception: if there are multiple breakpoints set within the program, then the program will go through each one of them individually until it reaches the last breakpoint).
Initiating Debugger Mode
Debugging can be initiated in two ways.
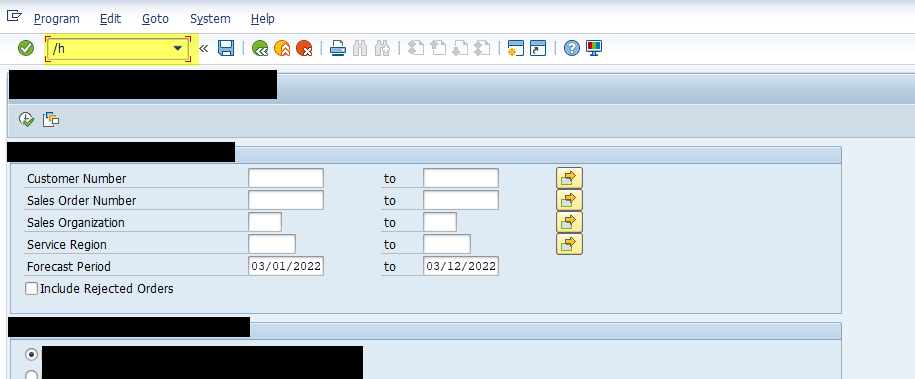
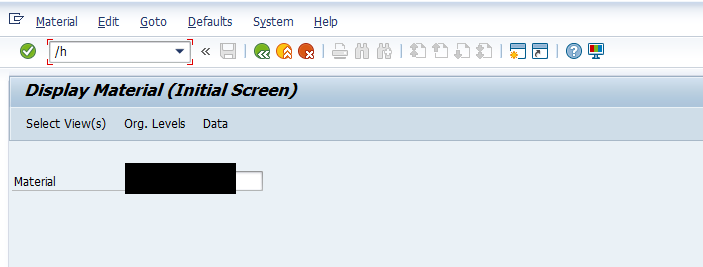
In the first, you type /h in the command field and press enter. You will then see a success message like in the figure below, which indicates the debugging mode is switched ON. If you press F8 or click the execute button, the session will take you to the debugger tool where you can examine the code.

In the second way, you put a breakpoint in a specific line of the program. To do so, follow these steps:
- Go into the program, function module, or method via transaction code SE38/SA38.
- Place the cursor on the line where you want to put a breakpoint.
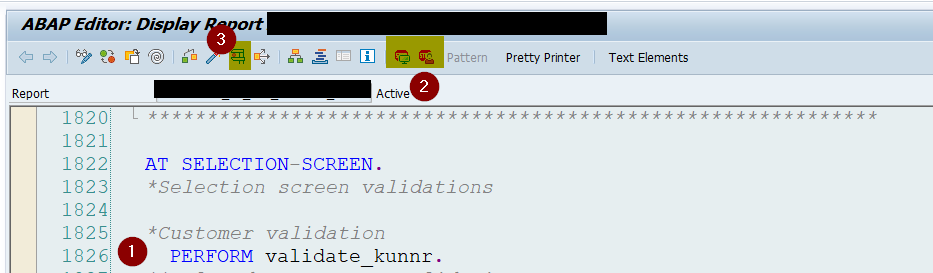
- Click the stop icon as shown in the below figure and execute the program.
- Your session will open the debugging tool and the complier will stop in the place where you kept the breakpoint.
Debugging Use Cases
Let’s look at three of the most-common use cases where basic ABAP skills can help us debug and resolve issues.
In the first case, you need to see where an error is coming from—your user is encountering an error and needs your help to troubleshoot. Executing the code line by line and going to the error message will be time consuming. Let’s look at a quick way to find the error message in the program by using the debugging tool.
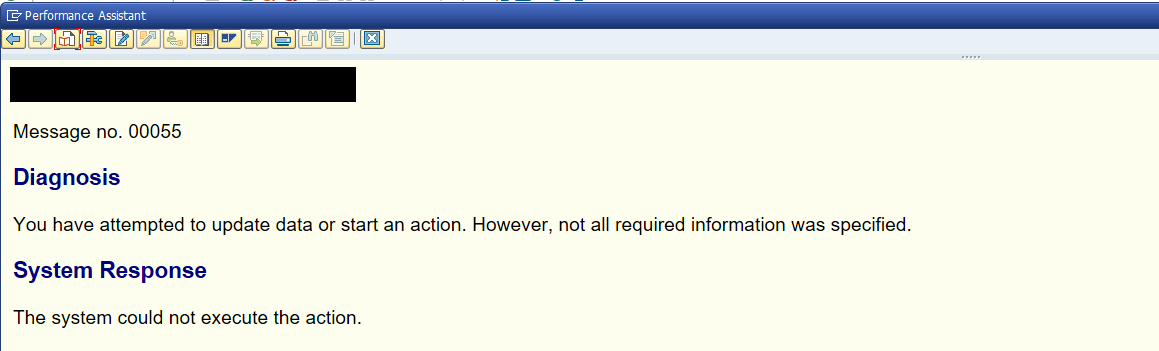
Let’s say the figure below denotes the error message the user is seeing.

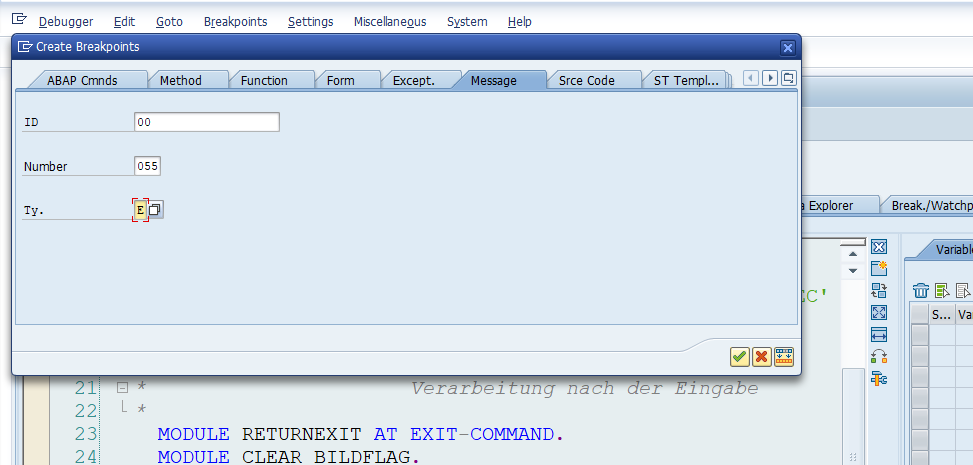
You first reproduce the error on your system and then do the following. First, click the error message, which takes you to the screen shown below where you can see the message class and message number. We can recognize what the message type is by seeing the type of message. The message number has different sections within it, where 00 represents message class and 055 is the message number.
On the error screen, type /h in the command field and hit the enter key to start the debugger.
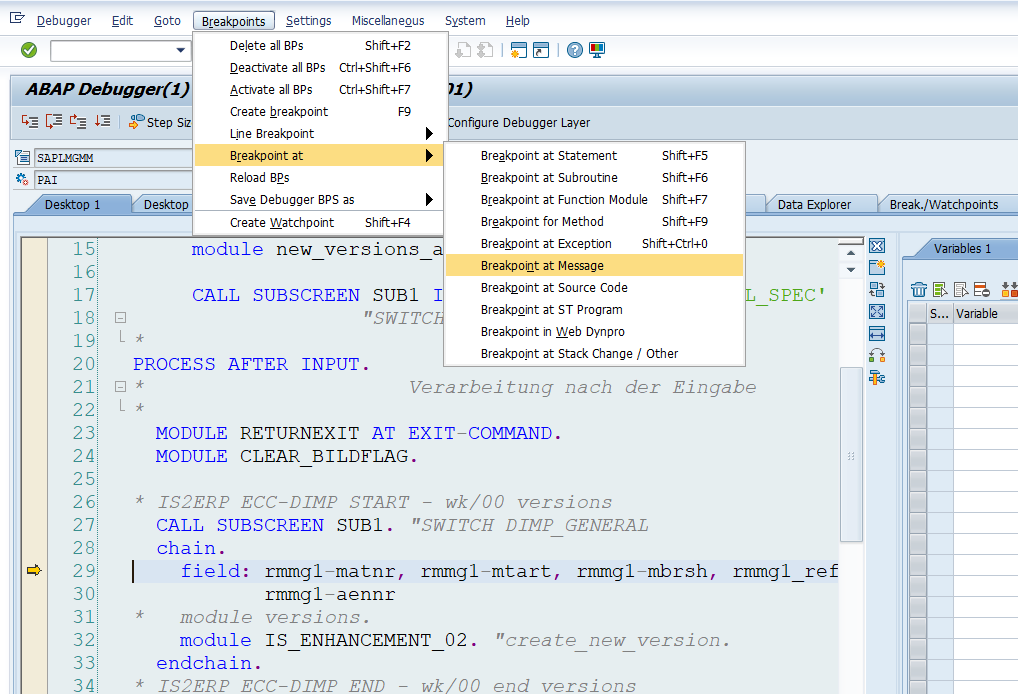
Once you hit enter, the debugger tool will become activated and open in another session. On the debugger screen, go to Menu > Breakpoint > Breakpoint at > Breakpoint at Message to open the following screens, where you can get the info collected from the error message. Hit enter.
Upon pressing F8, the compiler will stop in the program where the error has occurred.
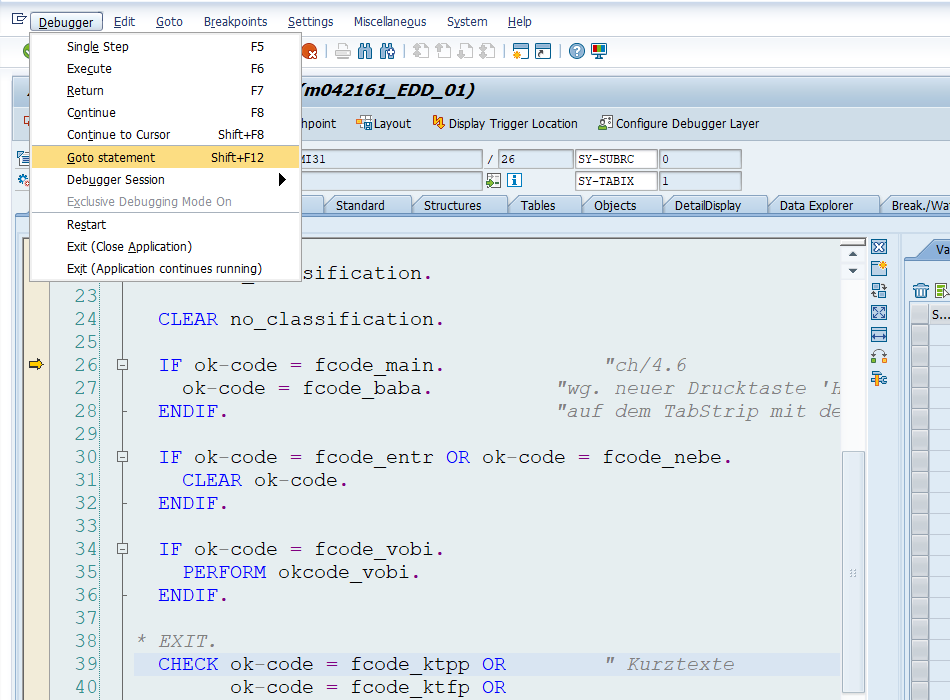
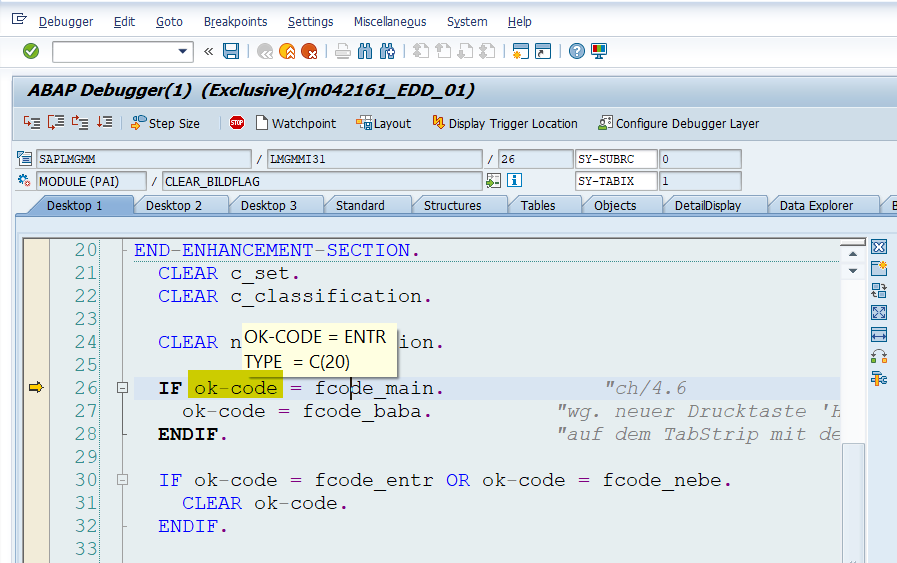
In the second use case, you bypass a code block by going to the specific program line inside the debugger. Consider: you are in program line 26 in the debugger, want to ignore a few sets/blocks of codes, and want to move to line 39 directly. To achieve this, go to Menu > Debugger > Go to Statement or press Shift + F12.
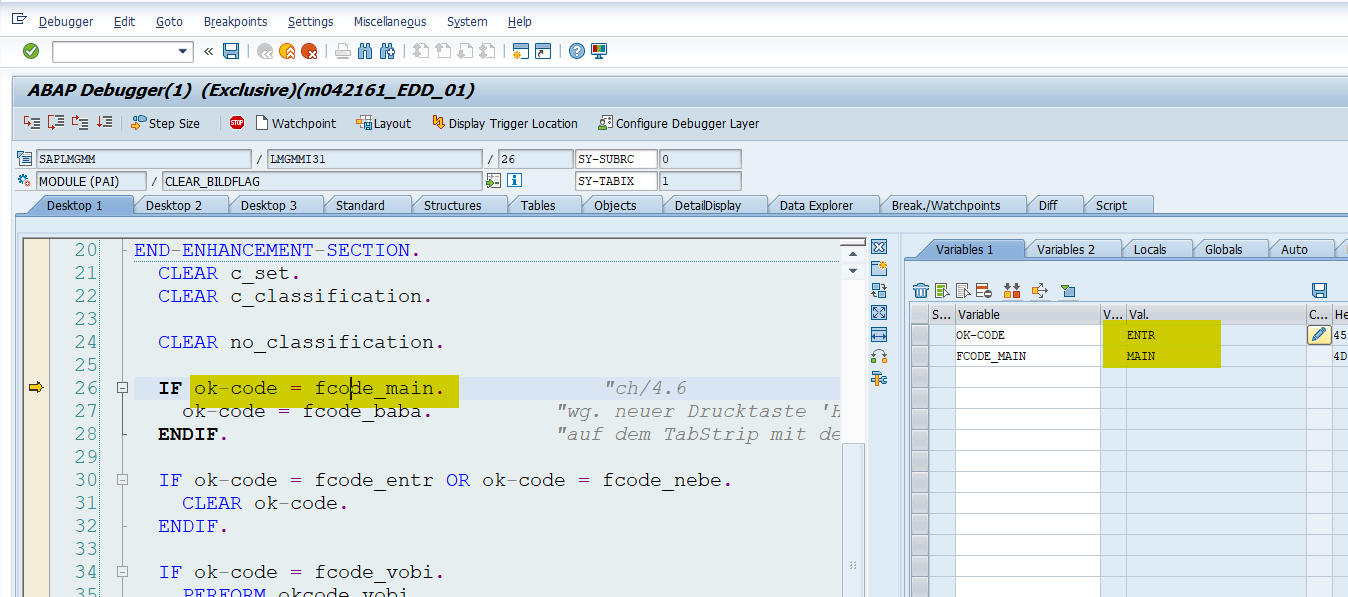
In the last use case, you want to check the data of variables, internal tables, and structures. You can place your mouse pointer over any variable to learn its data type and characteristics.
Similarly, if a user wants to know the data used for the variable, you can double click the variable to see its data in the variable window that shows up on the right side of the debugger screen.
Smart Forms
Smart forms are a tool provided by SAP for the maintenance of PDF forms, on which the application data from an SAP system can be the output. The T-code for smart forms is SMARTFORMS.
Techniques and Features
Once a form is created and activated, it generates a function module for use in the driver program. Since this function module name is dynamic, the driver program uses a special FM given by SAP (“SSF_FUNCTION_MODULE_NAME”) to determine the function module name in runtime.
After determining the smart form function module name, the driver program calls the smart form FM to create the output.
Use Case
Below is a very commonly seen use case that, when having smart form knowledge, can help you troubleshoot and save time for end users and development teams.
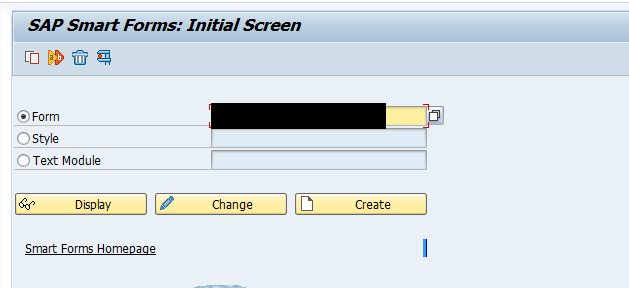
To debug a smart form or go to the code block where you want to do some troubleshooting, follow these steps. First, open the smart form in your test system using the T-code SMARTFORMS and click “display.”
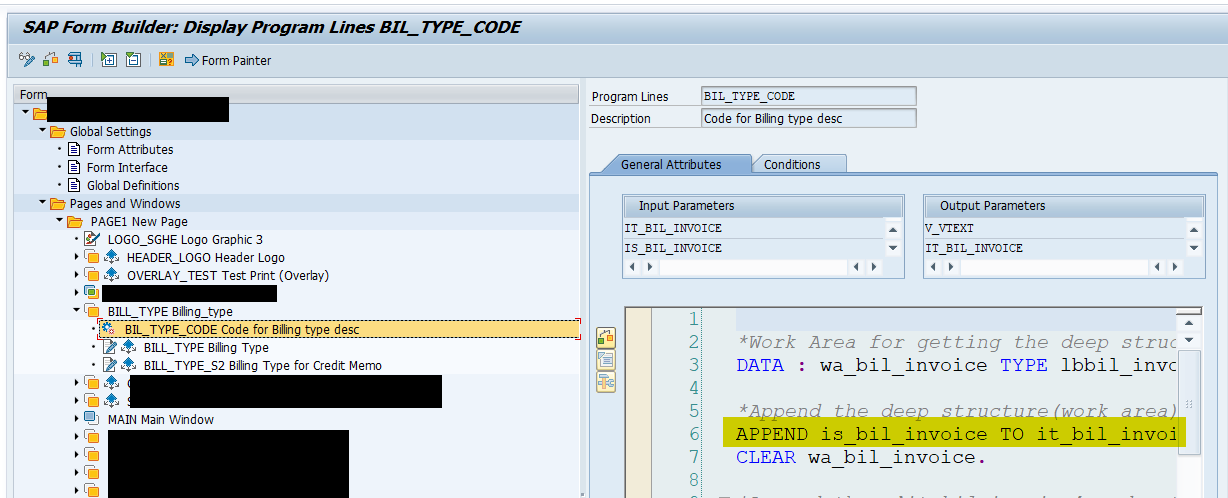
Your smart form will open like the one below. In the tree-like structure on the left, go to the specific line of code in the program you want to debug. Copy the program line and keep it handy.
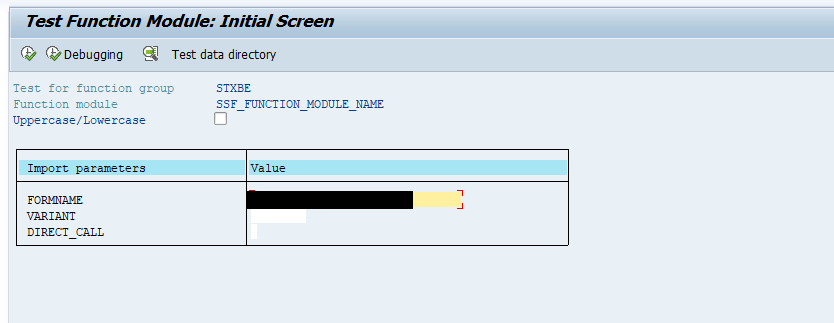
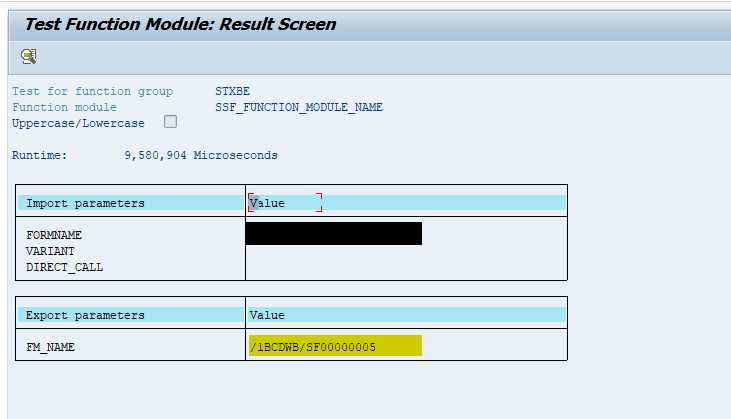
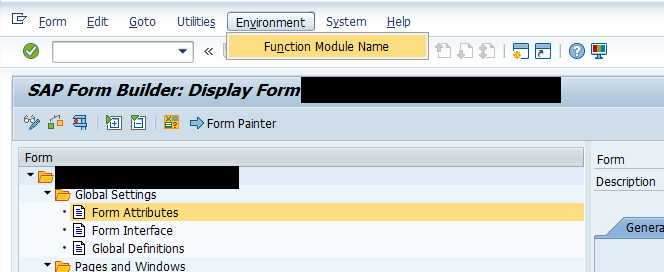
Since we are trying to keep a breakpoint, we need to know the smart form FM upfront. To find it, Go to Menu > Environment > Function Module Name.
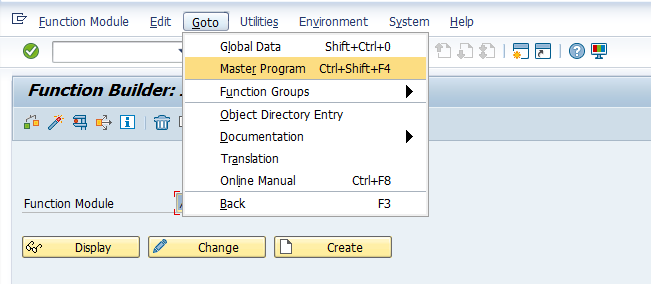
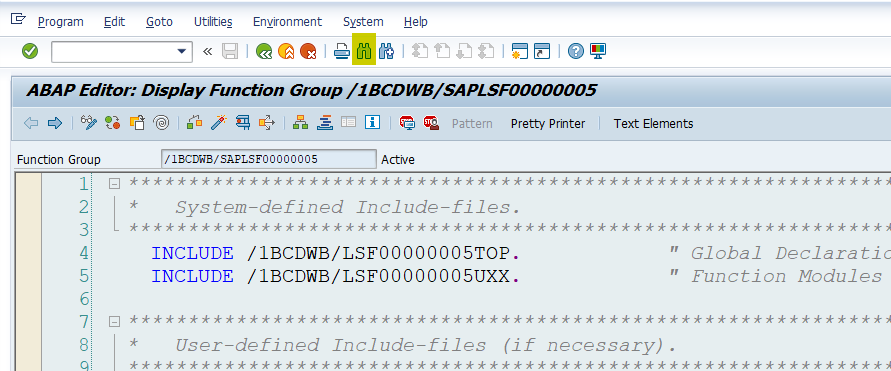
Use T-code SE37 to open the smart form function module and navigate to main program as shown here.
Upon opening the main program, click the Find button—it looks like binoculars—highlighted in the below screenshot to search the program lines copied from smart form.
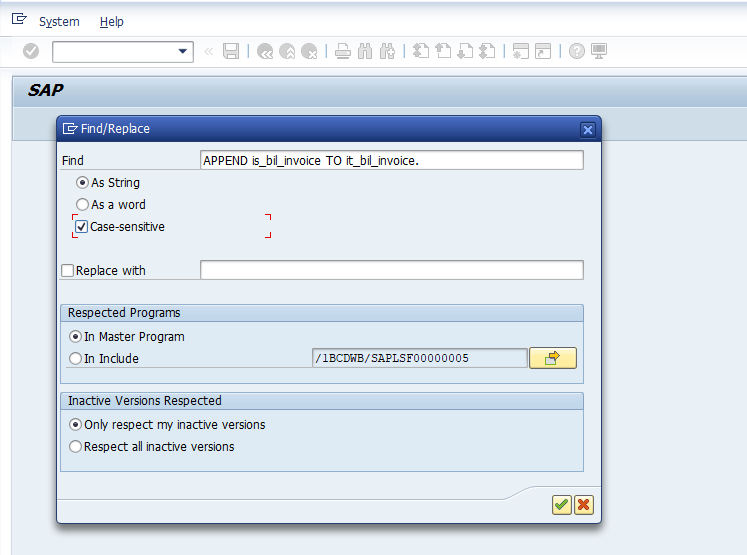
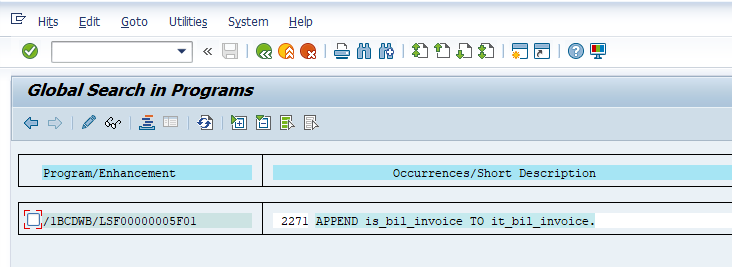
Search the program line in the main program as shown in the next figure. It will take you to the place where it is used.
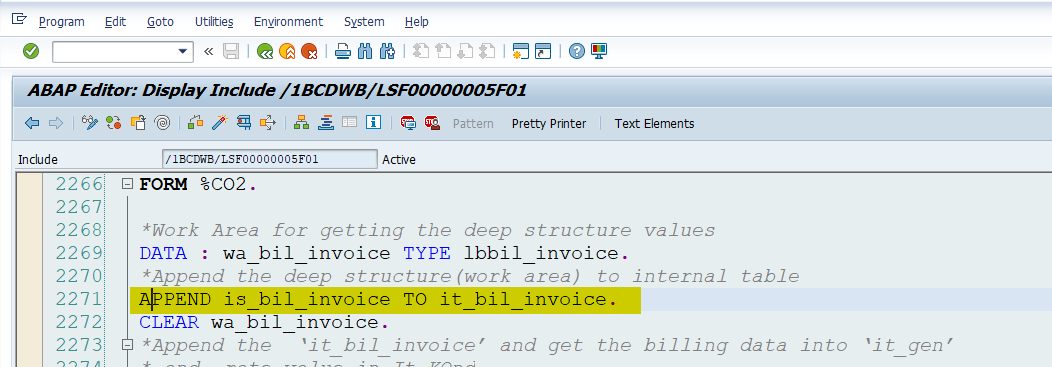
Upon finding the program line, place a breakpoint by clicking the Stop button and keeping the cursor in the line.
Next, execute the driver program or rerun the transaction for PDF output. The debugger tool will stop in the place where the user kept the breakpoint. Then you can follow the steps outlined earlier in this post to arrive at the output value you want to debug.
Conclusion
We hope this post has got you excited about the technical skills of ABAP debugging and smart forms, and that you try them out in your sandbox system. We would love to hear your comments and feedback, so please feel free to leave a comment below!
This post was originally published 7/2022.


Comments