
AVC in SAP S/4HANA uses a new valuation interface for simulations, which differs significantly from the simulation interface of the classic variant configuration (LO-VC).
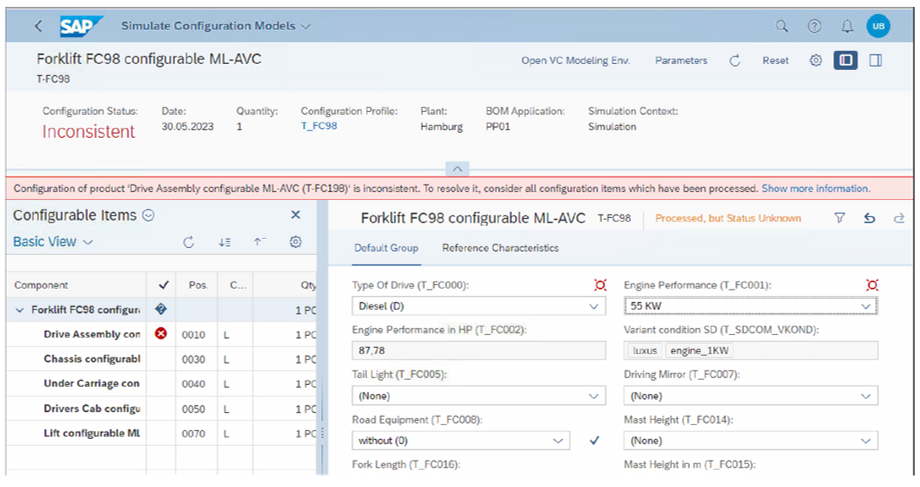
The new simulation capability is accessed in SAP Fiori via the Simulate Configuration Models app, as shown in the figure below. Alternatively, you can navigate within Transaction PMEVC by clicking the Test icon. The classic Transaction CU50 simulation cannot be used for AVC simulations.
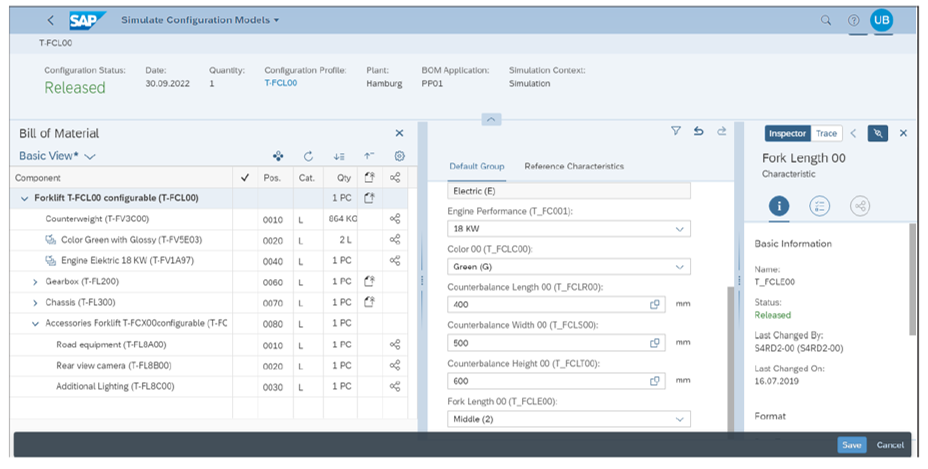
Let’s take a closer look at this simulation environment: The UI consists of a header area, the structure area of the characteristic valuation, and the pane for switching between the Inspector and Trace. Of these three areas below the header, the characteristic valuation area is permanently visible, and this area is where characteristic valuation takes place.
Let’s look more closely at these individual areas next. The header area can be hidden by clicking the Compress Header Area icon. In the header area, you can find two buttons for further settings. Clicking the Parameters button opens the Edit Simulation Parameters popup window, as shown in this figure.
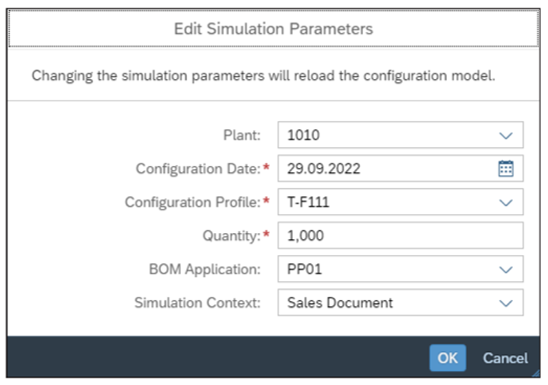
Editing Simulation Parameters: Note that, in addition to the mandatory items, the Plant and BOM Application fields must also be filled in; otherwise, no BOM will be displayed, which is also a prerequisite for displaying the configuration structure. A routing requires you maintain the Plant field. Especially when using the Simulate Configuration Models app in SAP Fiori, you must pay attention to these parameters. For this reason, we recommend clicking the Create New Simulation button. In this way, the Edit Simulation Parameters popup window will be launched automatically, and these settings won’t be overlooked.
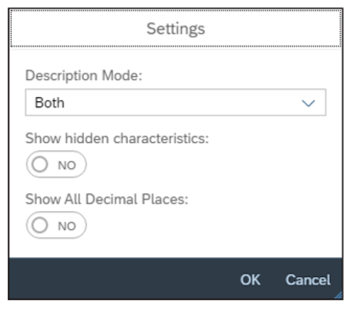
Clicking the Settings icon will open another popup window, as shown in the following figure. In this window, you can set, among other things, what the left and middle areas should display (i.e., the characteristics, values, and objects of structures) and whether to display their names (key), their descriptions, or both.
The inspector and structure area can each be shown or hidden using the two buttons.
The structure area on the left can contain the following information:
- Information on the exploded BOM and on the super BOM
- Information on the exploded routing and on the super routing
- Information about the configuration structure
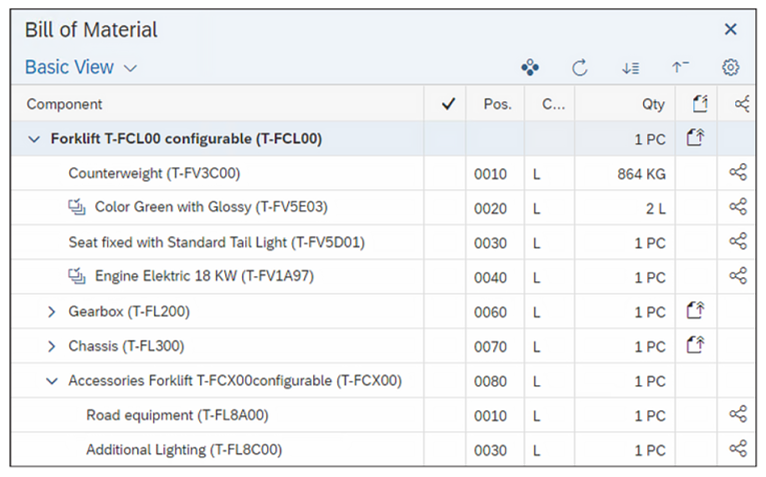
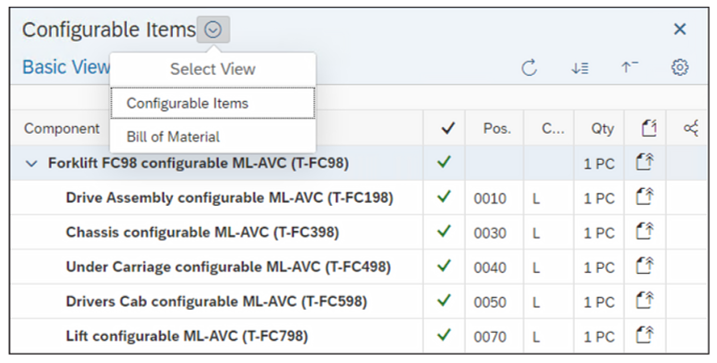
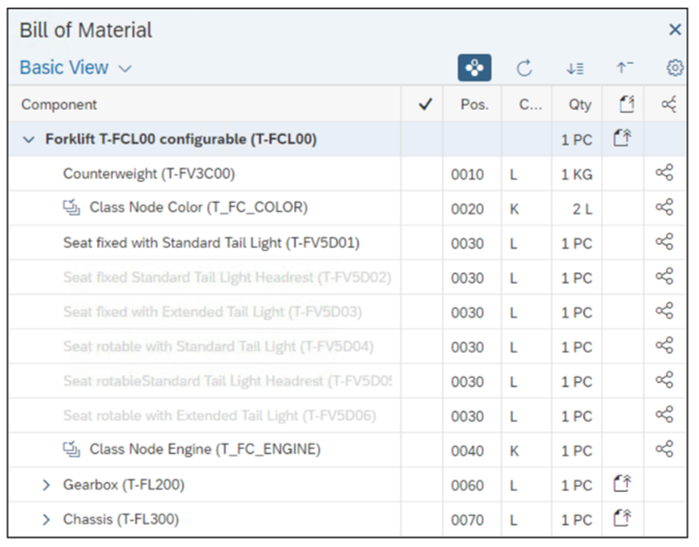
In the structure area, you’ll find the exploded BOM for single-level configuration in the standard system, as shown in the next figure. In the case of multilevel configuration, you’ll see configurable items, for instance, the configuration structure BOM (shown in the second figure).
By clicking the Show/Hide Super BOM icon, you can display the super BOM, as shown in the next figure, where the same BOM as before will be displayed. What is the difference between the two BOMs now? In the case of the super BOM, all items are listed. (Items that are invalid due to selection conditions are displayed in gray.) Furthermore, the class nodes are listed directly, not the replaced components. These listings are not permanently updated, but the update must be triggered manually by clicking the Explode BOM Again icon.
The display of the structure area can be customized using custom views; for instance, you can modify the column selection by clicking the Settings icon.
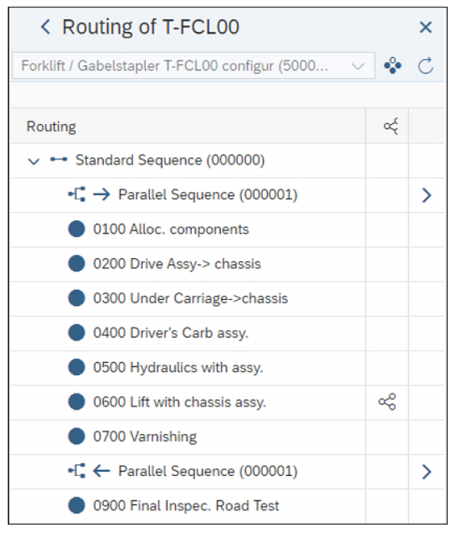
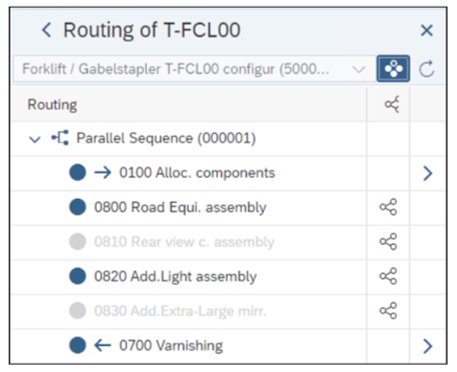
In the penultimate column , you’ll see where routings exist. Click the Routing icon in a line, and you’ll switch to its routing view in the structure area. Again, you can switch between the super routing and the exploded routing. The routing shown in the following two figures has a parallel sequence in addition to the standard sequence. You can switch between these sequences by clicking the arrow icons in the last column.
The central area with the characteristic valuation is used for the actual configuration. In this area, the characteristics of the variant class(es) are valuated. Must-have characteristics are indicated by small red asterisks. Non-valuated CHAR characteristics are displayed with the (none) entry. Non-valuated NUM characteristics show the allowed value range, and characteristics valuated with default values have a green arrow icon. Clicking this green arrow icon allows you to make a manual valuation different from the default value. For single-value CHAR characteristics, clicking the down arrow icon will display a dropdown list, but for multi-value CHAR characteristics, use the (F4) help icon, which also responds accordingly.
In the header of this area, you’ll find a number of buttons: Clicking the Filter icon enables you to filter the list of characteristics, and clicking the Undo icon undoes the last manual action. You can click the Repeat icon to undo the undo, that is, to jump forward in terms of user action.
The inspector area contains detailed information about the individual elements of the configuration model. You can also conduct a trace, in which the processing of object dependencies is logged in detail.
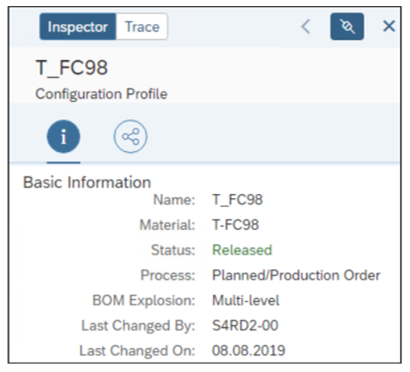
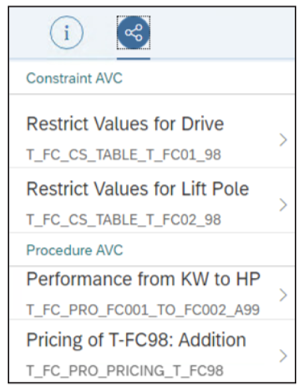
Some examples of the inspector are shown below. For the object you clicked on last, detailed information about the check will be displayed. Starting with the screen shown below, the simulation environment header, the configuration profile can be clicked. The relevant inspector information is shown in the next two figures. Two views enable you to access relevant data via the Basic Information icon or via the Object Dependencies icon. While viewing object dependencies, click the right arrow icon to jump to the corresponding object dependency in the inspector.
Similarly, BOM headers (also from the structure of configurable items) and the BOM components, including the class items, can be shown. The same two views are available.
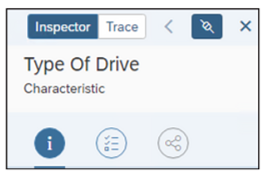
For characteristics, an additional view is the Values view, which you can access by clicking the (Values) icon, as shown here.
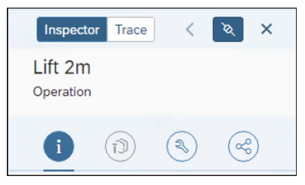
For operations, component assignments are accessible by clicking the icon, and production resource/tool assignments are accessible by clicking the icon, as shown here.
The next figure shows the behavior of the simulation environment when inconsistencies arise. A message appears in the header, highlighted in red, for example, the message: Configuration of production ‘Drive Assembly configuration ML-AVC (T-FC198)’ is inconsistent. To resolve it, consider all configuration items which have been processed.
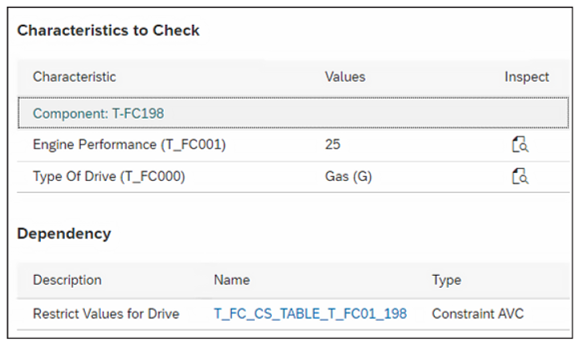
The Show more information link is active, and clicking this link will open the popup window shown below. For characteristics and dependencies to be checked, you’ll be redirected to the inspector with the corresponding data.
On the right side of the simulation environment, the trace can be displayed in addition to the inspector. By default, the trace is inactive. As a result, in a standard system, the processing of the configuration isn’t logged. You can activate logging by clicking on Trace and then clicking the On icon.
Now, the entire configuration will be logged. The next figure shows some initial entries. In this overview, you can click on any entry with a blue background to access further information. For most objects, the following functions can be performed here:
- Filtering the trace
- Check (i.e., switching to the inspector)
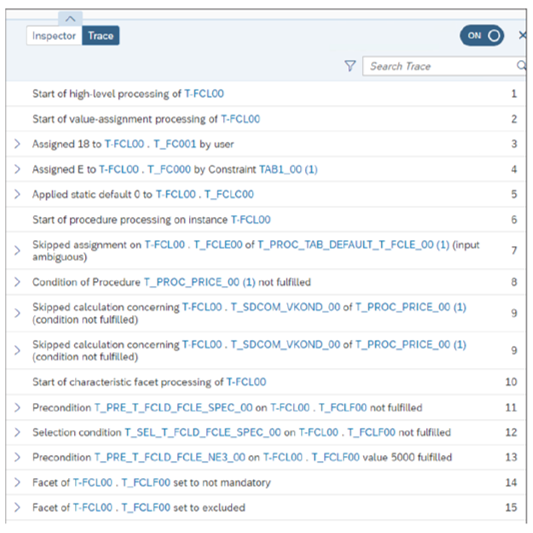
The following can additionally be called for characteristics:
- You can filter by the valuation in the trace (where changed).
- You can filter the usage of a characteristic in the trace (where used).
By expanding the entries in the trace, as shown above, by clicking the arrow icon of a line), you can access more detailed logs of the individual steps. Two examples are shown in the final figure.
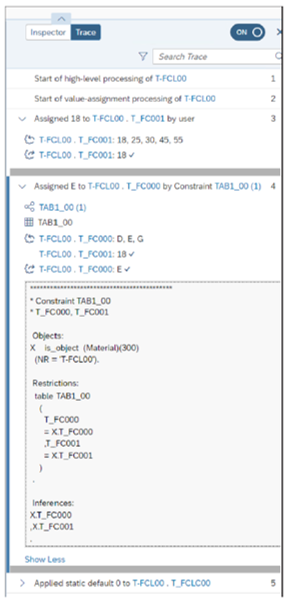
Step 3 involves the manual valuation of a characteristic, and step 4 involves valuation via a constraint using a variant table. On this screen, you can click on the entries highlighted in blue to jump to further information.
Learn Variant Configuration in Our Upcoming Rheinwerk Course!
Design, implement, and manage models in SAP S/4HANA—either classic LO-VC or the new AVC—using a realistic product configuration scenario. Click on the banner below to learn more and order your ticket.

Editor’s note: This post has been adapted from a section of the book Advanced Variant Configuration with SAP S/4HANA by Uwe Blumöhr, Andreas Kölbl, Michael Neuhaus, and Marin Ukalovic.


Comments