
IAS 8 and FASB Statement No.131 have detailed guidance on which items of revenue and expense are included in segment reporting so that all companies will report a standardized measure of segment results.
Disclosures relating to segment reporting include the following:
- Revenue from sales to external customers and to other segments
- Amount of depreciation and amortization for the period and other noncash expenses
- Share of the profit or loss of equity-accounted entities and their relevant investment balances
- Segment result between continuing and discontinued operations
- Goodwill, total assets, and total liabilities
- Capital expenditure
- Nature and amount of any material items of segment revenue and expense that are relevant to explain the performance of a segment
Reports vary depending on the approach used. The splitting and balanced books capability combined with the right reporting solution and objects allow you to get segmented financial statements in SAP S/4HANA. Let’s first review the trial balance and financial statement apps in SAP S/4HANA Finance.
Trial Balance
The Trial Balance report is used to validate account balances when preparing the segmented financial statements. With SAP S/4HANA, two trial balance apps were introduced: Trial Balance (app ID F0996A) and Trial Balance Comparison (app ID F2767). Both are analytics apps that support multidimensional analysis and read from the Universal Journal. The multidimensional analysis of the query behind the apps enables you to analyze results sets for any available dimension.
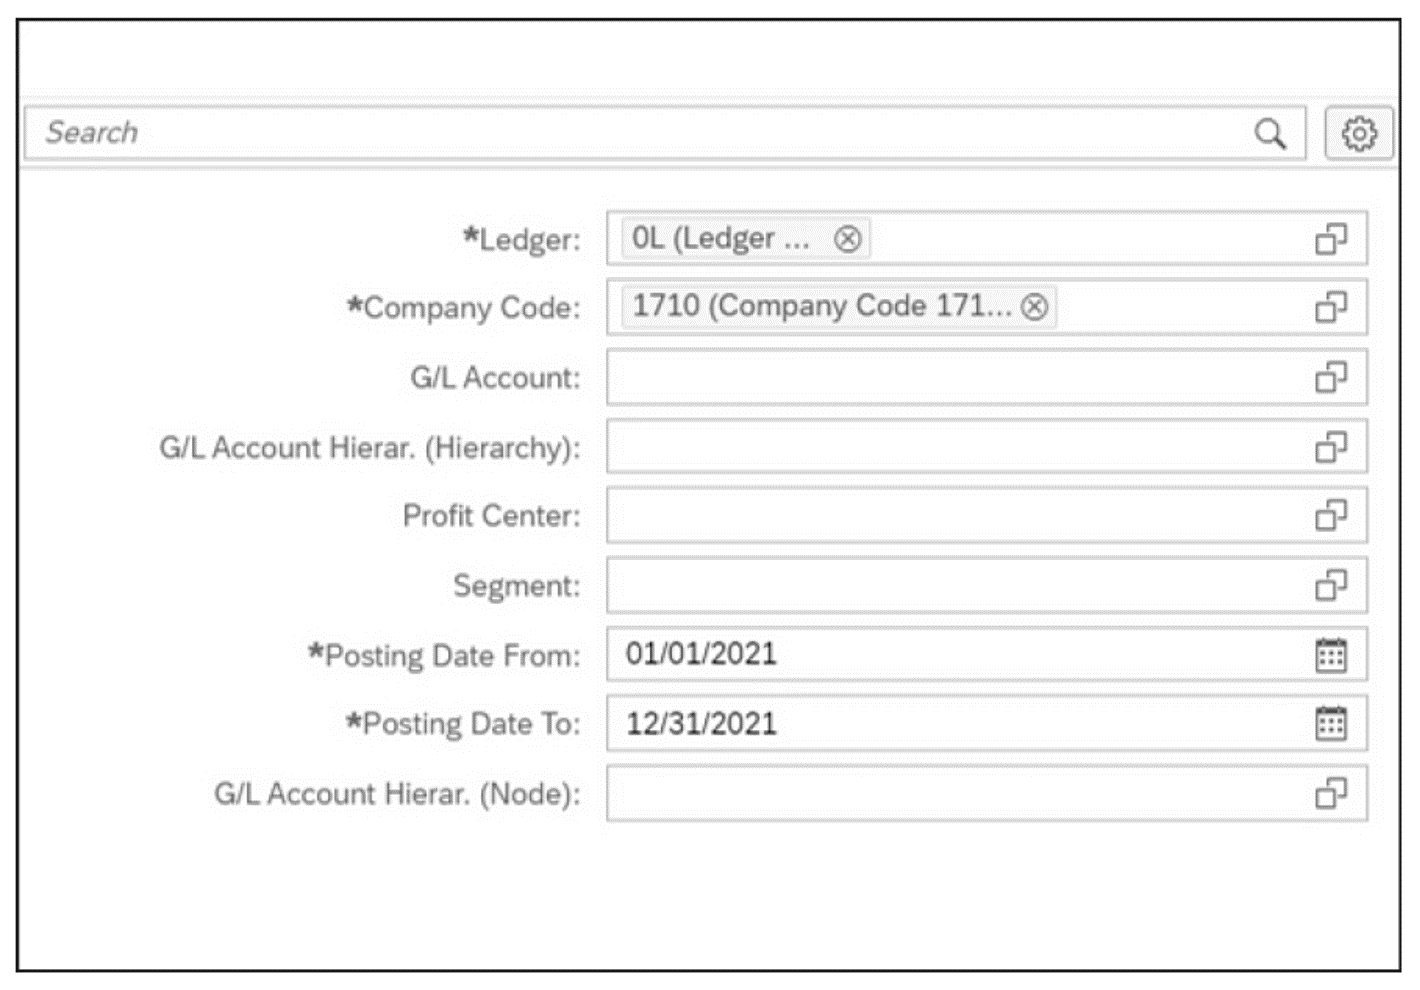
When you execute the Trial Balance app in the SAP Fiori launchpad, a selection screen will appear (see below). Here, you input your filter values for the trial balance report. The report has mandatory input filters marked with red asterisks, such as Ledger, Company Code, Posting Date From, and Posting Date To. You can select single or multiple values in your filter, as well as add more filter dimensions by clicking the Settings button. For example, you can add segment reporting dimensions in the prompts, such as segment and profit center, and update the filter values for these dimensions. If you have too many dimensions added to the selection screen, you can use the search box to locate a dimension and apply filters.
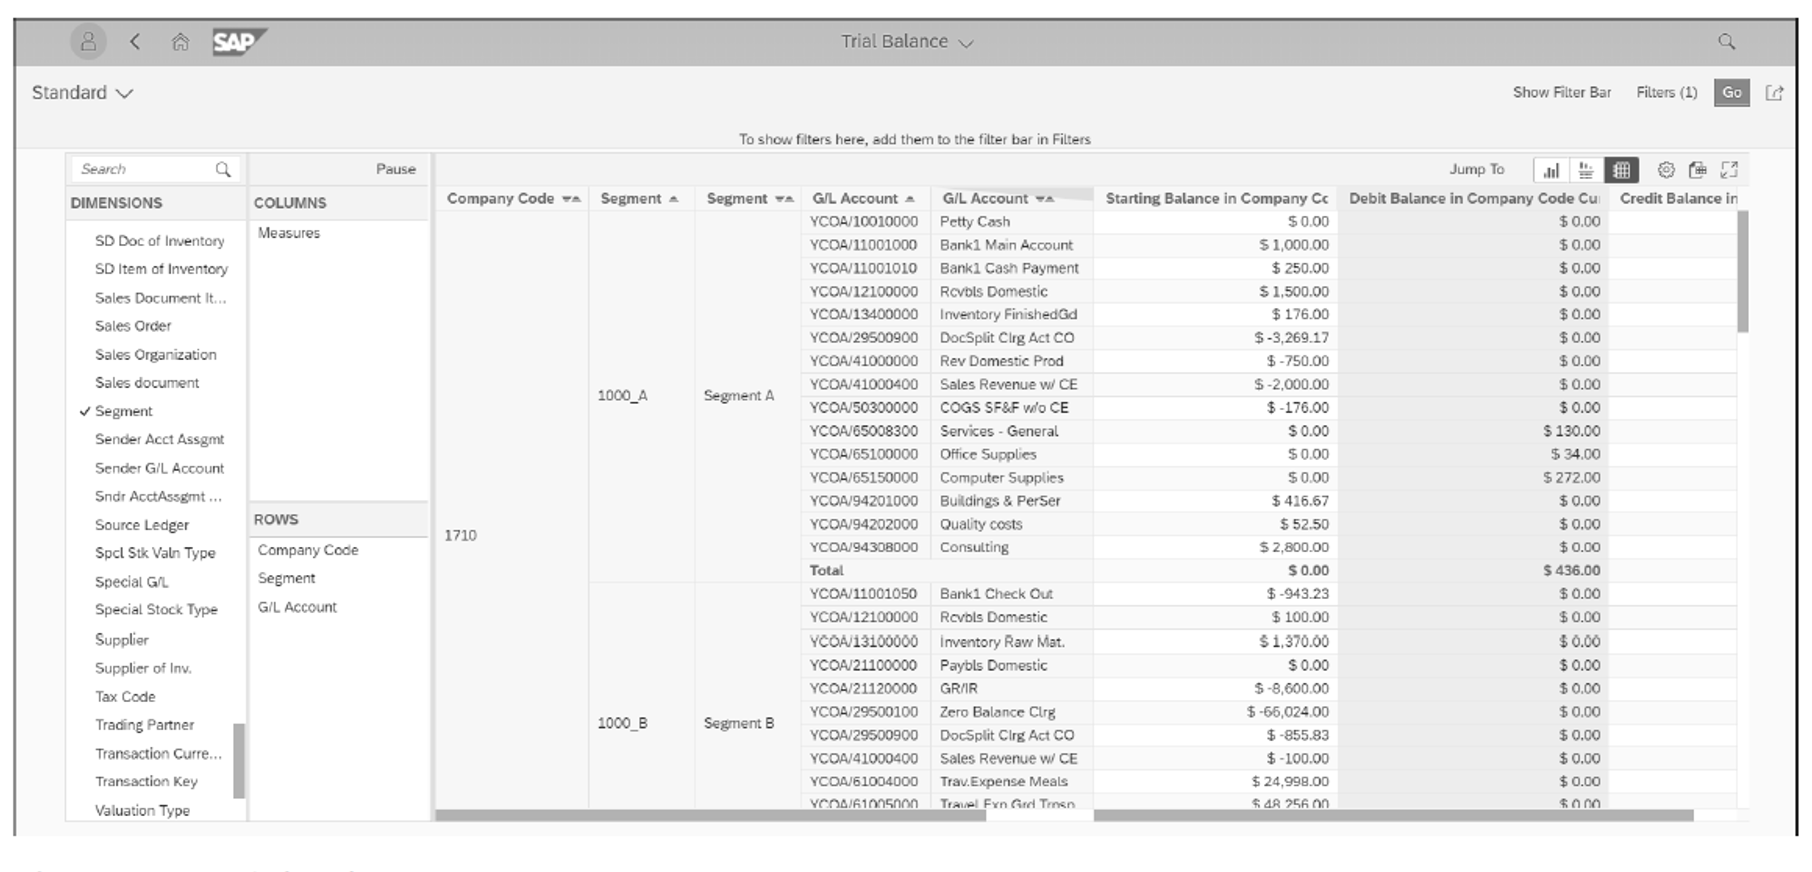
After filter prompts are applied, the results set of the Trial Balance app displays Starting Balance in Company Code Currency, Debit Balance in Company Code Currency, Credit Balance in Company Code Currency, and Ending Balance in Company Code Currency for the selected Measures. You can add Dimensions to the report’s rows or columns by dragging and dropping. For example, if you add a fiscal year period dimension to the report’s rows or columns, the report’s results set will show balances by fiscal year/periods. You can search for dimensions and add them to the results set.
Right-clicking a dimension will show the context menu from which you can change how the dimension is displayed. For example, you can add the hierarchies and attributes of the dimension or simply display the keys instead of the text. The figure below shows a segment dimension along with the general ledger account hierarchy in the rows of the results set.
The results set can be shown as a chart, table, or chart/table by clicking the Display button. To improve the UX, we recommend pausing the report while making the layout settings (especially if a large set of data is selected) and refreshing the results once the desired layout is set. The Pause button is in the navigation panel. You can also create a layout variant of the app with filters already filled in so that you don’t need to reenter the information. You also can export the results to Microsoft Excel for further analysis.
You can update prompts from the report output screen by choosing Settings > Show Prompts (see above figure).
Warning: SAP S/4HANA analytics apps don’t read from the aggregate table; instead, they read directly from the line-item data, mainly from the Universal Journal. Even with a powerful SAP HANA database, a large data set may cause performance issues. The following are recommendations to reduce the risk of performance issues:
- Use prompts to filter the data and save it as a new tile.
- Pause your results set until you finish making layout changes. Once you’re done, click Refresh in the navigation panel to see the latest data.
- Filter the dimensions in the results set via the dimension’s context menu (right-click the dimension).
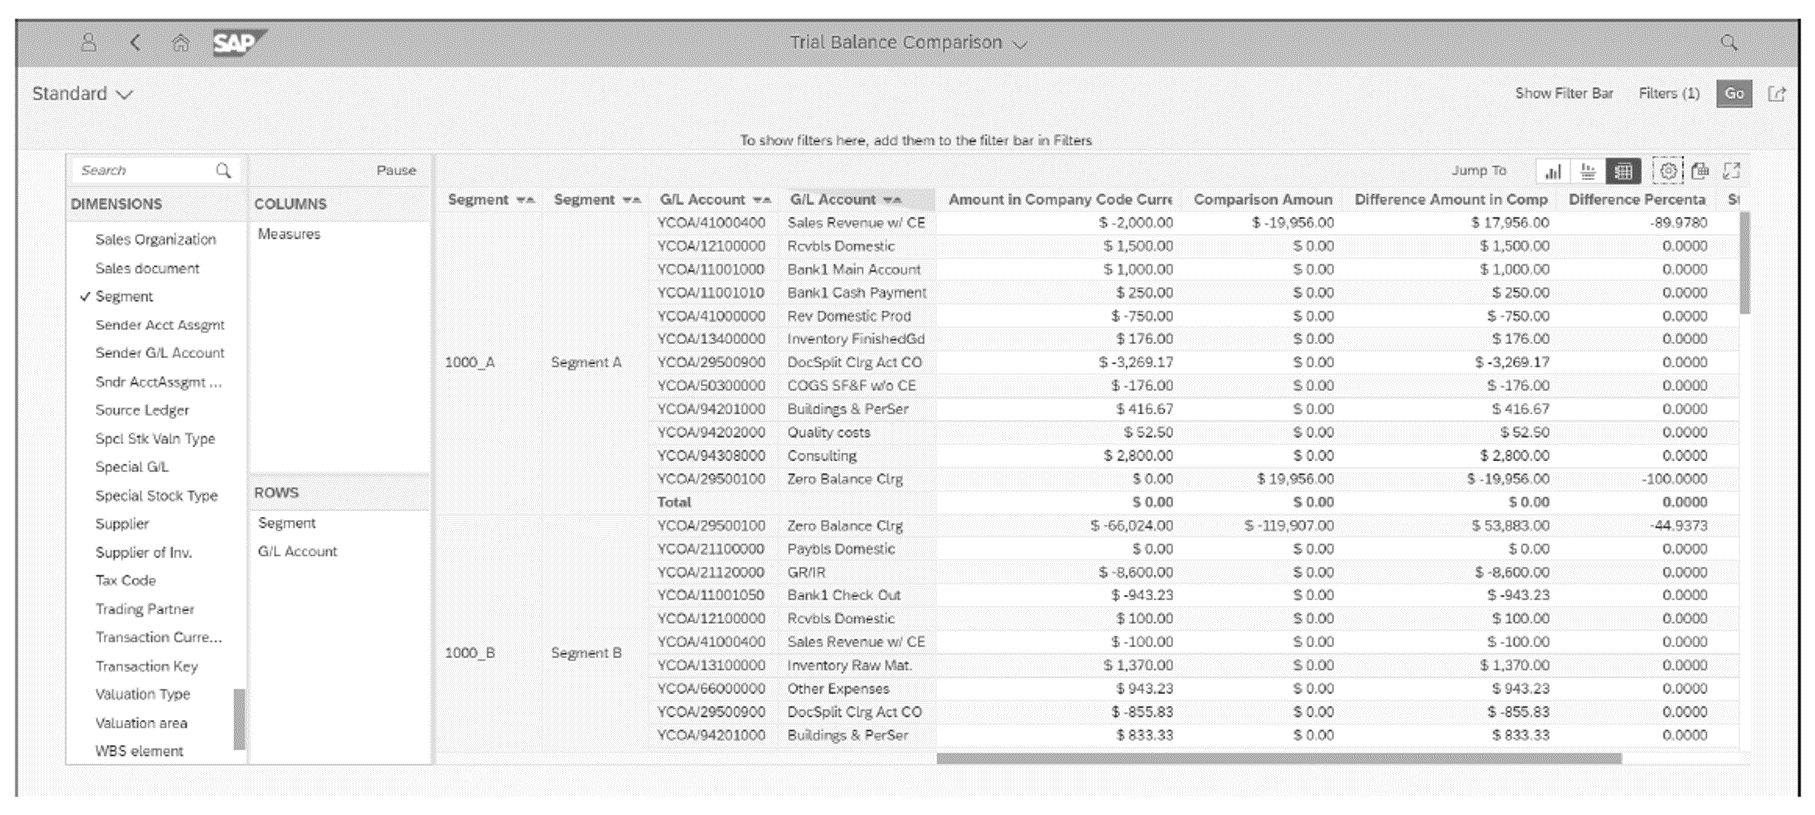
The Trial Balance Comparison app (app ID F2767) is another powerful app, similar to the Trial Balance app. The Trial Balance Comparison app compares an account balance with that in another period/year specified in the prompt filters (see figure below).
Segmented Financial Statements
Financial statement reports are structured financial representations of the financial positions and financial transactions undertaken by an organization. Typically, a set of financial statement reports will include the balance sheet, income statement, cash flow statement, and supplementary notes. In this section, we’ll show you how to generate the segmented financial statement reports. There are two key financial statement apps in SAP S/4HANA: Balance Sheet/Income Statement (app ID F0708) and Balance Sheet/Income Statement – Multidimensional (app ID F3084). Both apps are analytics apps and read data from the Universal Journal.
Balance Sheet/Income Statement
When you execute the Display Financial Statement app (app ID F0708) in the SAP Fiori launchpad, a filter and empty results set will appear. Here, you input your filter values for the Display Financial Statement app. The report has mandatory input filters marked with red asterisks, such as Ledger, Company Code, Statement Version, Statement Type, End Period, Comparison End Period, and Currency. You can select single or multiple values in your filter, as well as add more filter dimensions by clicking the Adapt Filter button and selecting the corresponding dimension, such as Segment. Once you’ve entered your filter values, you can click the Go button. Each time you update the filter criteria values in this report, you need to click the Go button to refresh the results set. Financial statement values will be shown in the results set.
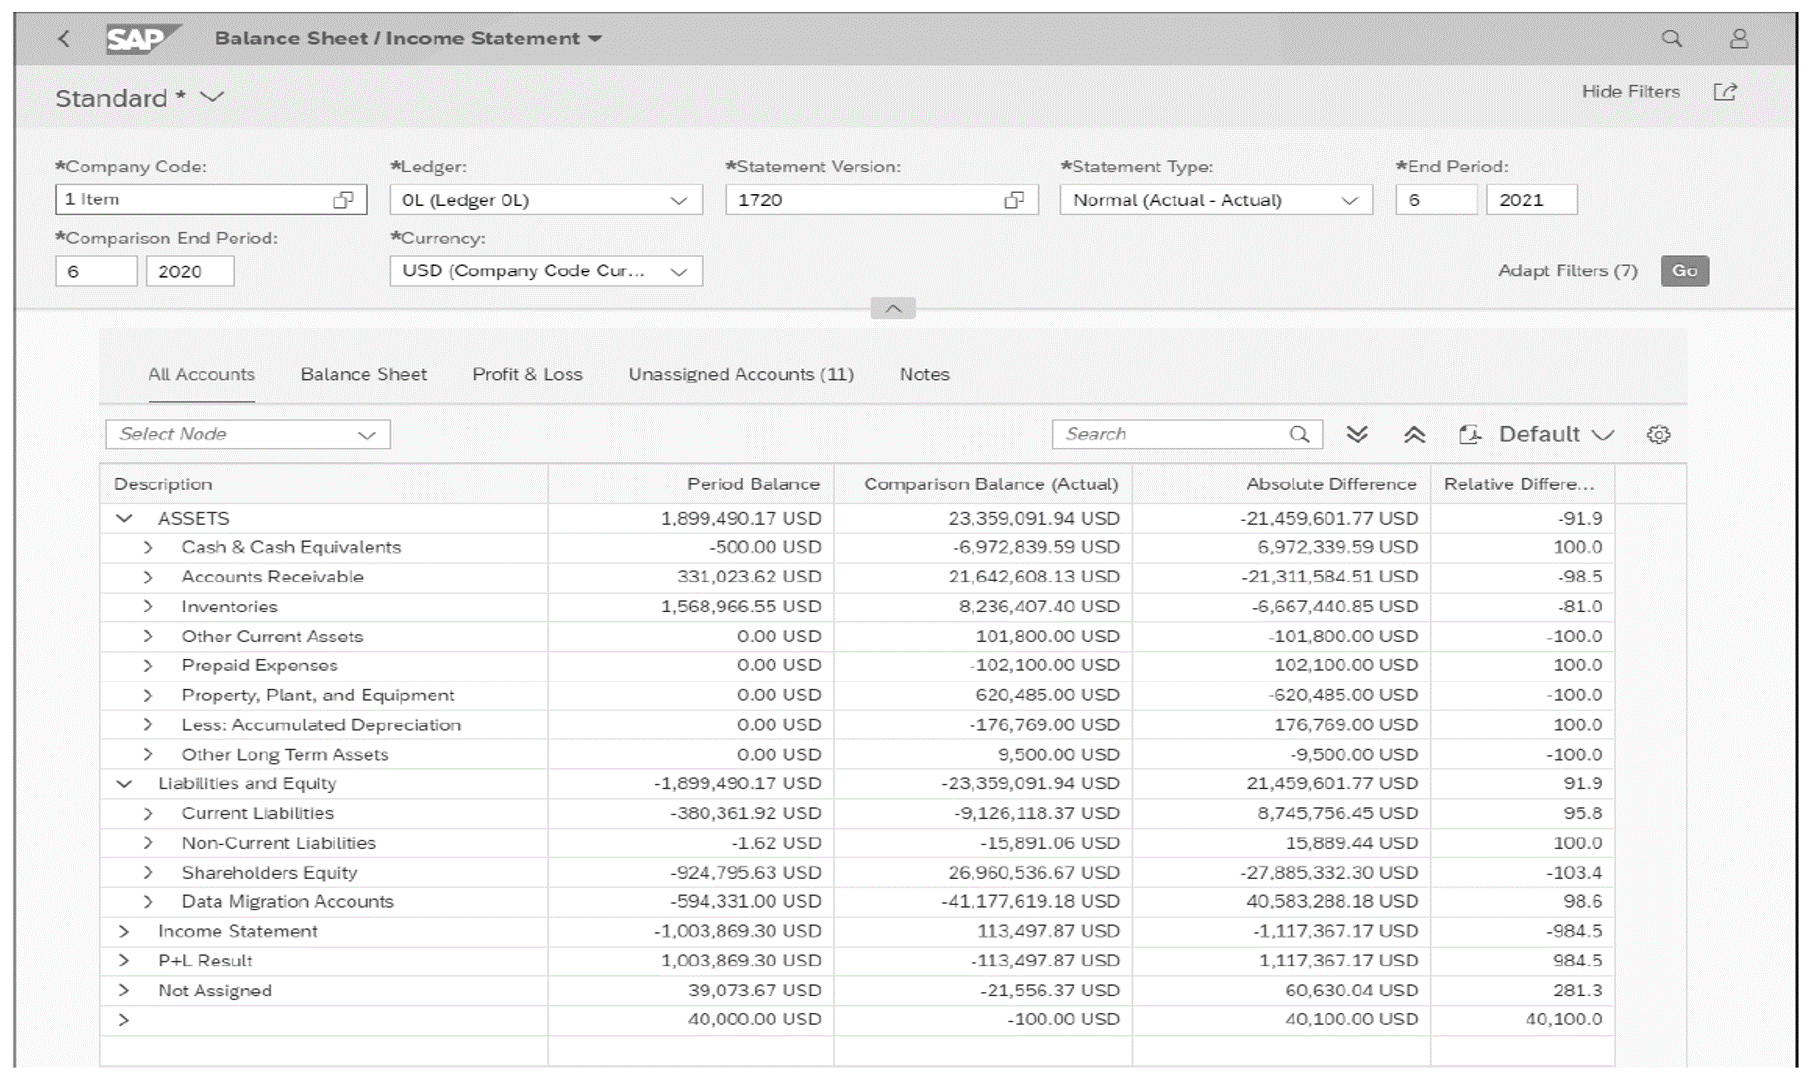
By clicking the All Accounts, Balance Sheets, Profit & Loss, and Unassigned Accounts tabs above the results set, you can navigate among the corresponding pages. The results set in the reports are based on all the relevant line items aggregated after you click the Go button. By clicking the figures in the results set, you can jump to the detail of the line items of a specific general ledger account and other reports. To bring segments or other dimensions to the results set, you need to click the Settings button and select the corresponding dimension; the results set will automatically be updated. The report can be exported as a PDF file using interactive Adobe forms.
The Display Financial Statement app supports time-dependent hierarchies. You can select the FSV key date in the filter criteria to display the financial statement version (FSV) of that date.
Note: To export financial statements to an Adobe PDF file, you need to click the Export to PDF button (refer to the previous figure). To maintain the forms to produce highly formatted financial statements, you need to use the Maintain Form Templates app (app ID F1434). With this app, you can maintain your financial statement form templates. SAP has forms that are pre-delivered and used as references (such as form FIGL_BSAIS_EN).
Balance Sheet/Income Statement – Multidimensional
The Balance Sheet/Income Statement – Multidimensional app is a standard analytics app used for analyzing segmented financial statements in SAP S/4HANA. You can access this app by clicking the Balance Sheet/Income Statement app tile in the SAP Fiori launchpad, which will open a window in which you can filter values for the report. The report has mandatory input filters marked with red asterisks, such as Ledger, Company Code, Hierarchy ID (FSV), Fiscal Year, Comparison, and Year. You can select single or multiple values in your filter and add more filter dimensions by clicking the Settings button.
For example, you can add segment reporting dimensions, such as segment or profit center, and update the filter values for these dimensions. After clicking the OK button, the results will appear on the screen in the SAP Fiori app.
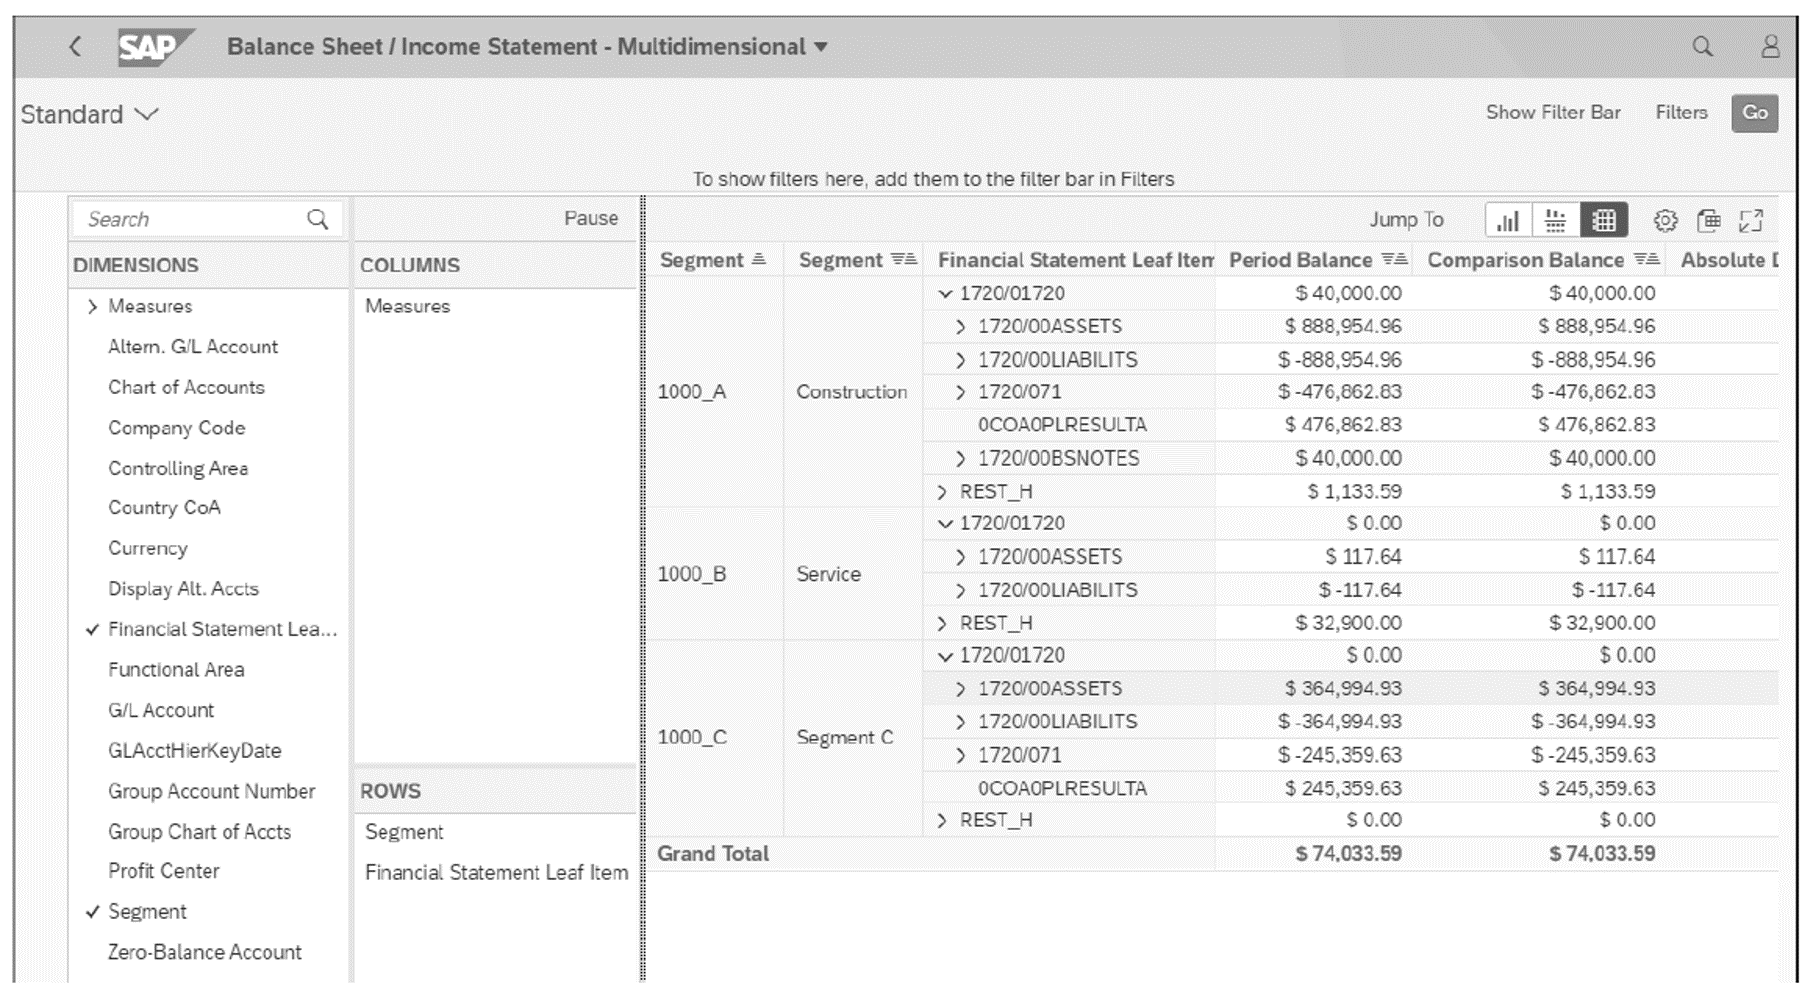
The results set displays Period Balance, Comparison Balance, Absolute Difference, and Relative Difference for the specified periods. You can search for dimensions and add them to the results set by dragging and dropping. Right-clicking a dimension will show the context menu in which you can change how the dimension is displayed. For example, you can add the hierarchies and attributes of the dimension or simply display the keys instead of the text. Here, we selected the segment dimension and added it to the results area to generate the financial statements by segments.
You can show the results set as a chart, table, or chart/table by clicking the corresponding display button. To improve the UX, we recommend pausing the report while making the layout settings and refreshing the results once the desired layout is set, especially if a large set of data is selected. The Pause button is in the navigation panel. You can also create a layout variant of the app with filters already filled in so that you won’t need to reenter the information in the future. In addition, you can export the results to Microsoft Excel for further analysis.
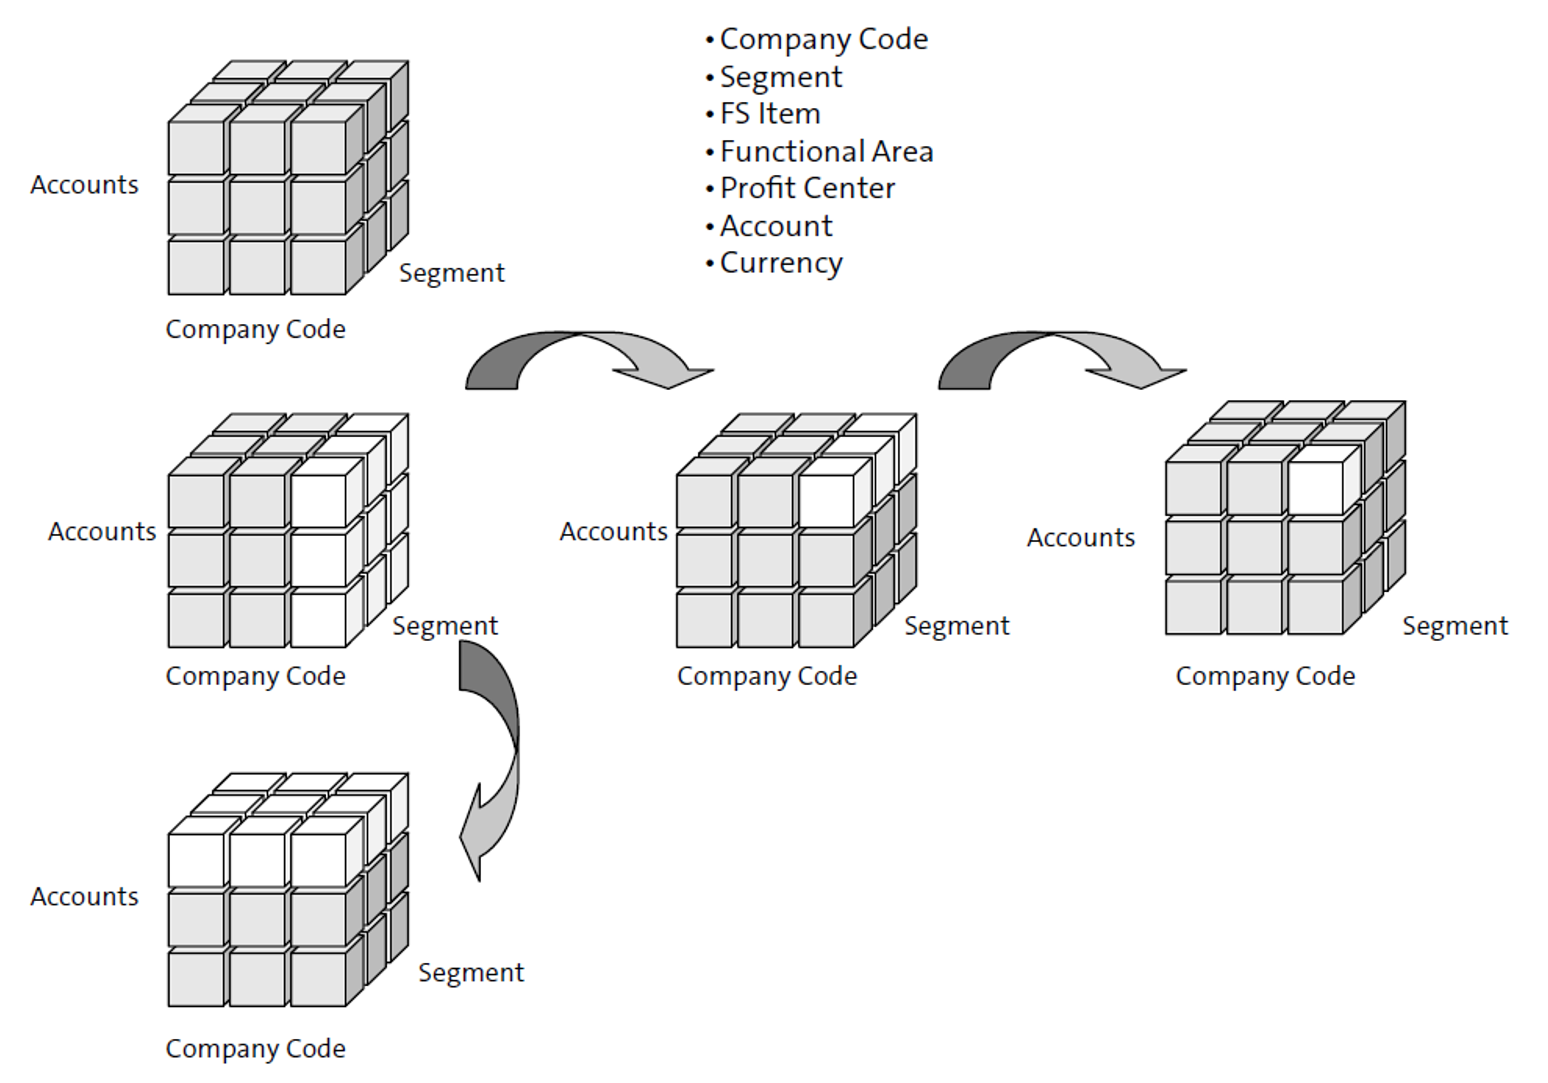
Drilldown Reporting Mechanism
The drilldown reporting mechanism is based on a multidimensional data set principle. The drilldown principle is illustrated below, which shows a three-dimensional data set represented by a cube. Typically, reports have more than three dimensions, but for illustration purposes, we used only three: accounts, company code, and segment. Each cube is composed of 27 small cubes. The edge of the small cube represents the value of the dimension. You can look at individual small cubes within the cube or at cross-sections of the cube. By swapping around characteristics, you can view the data from different perspectives.
Editor’s note: This post has been adapted from a section of the book Financial Reporting with SAP S/4HANA by Aylin Korkmaz.


Comments