
Manual forecasting is a unique functionality SAP Integrated Business Planning introduced for when you want a new forecast without a reference for a short period of time.
You can do this with seasonality and trend manually based on the planner experience. You can manage manual forecasting directly from the Manual Forecast app via the Manual Forecasting setting in the Forecast Dates tab. It doesn’t require a product assignment because there is no reference product available for manual forecasting.
Prerequisites and restrictions of manual forecasting are shown in the figure below:
- Forecasts can only be carried out for existing planning objects for the target key figure for forecasting. But planning objects aren’t required for the input key figure. Filters of statistical forecast runs aren’t considered.
- The product’s periodicity must have been selected for the forecast model (e.g., week).
- The launch dimension attribute or the master data type key attribute is included in the aggregation level selected in the forecast job.
- A business meaning of target unit of measure (UoM) must have been assigned for the planning area attribute.
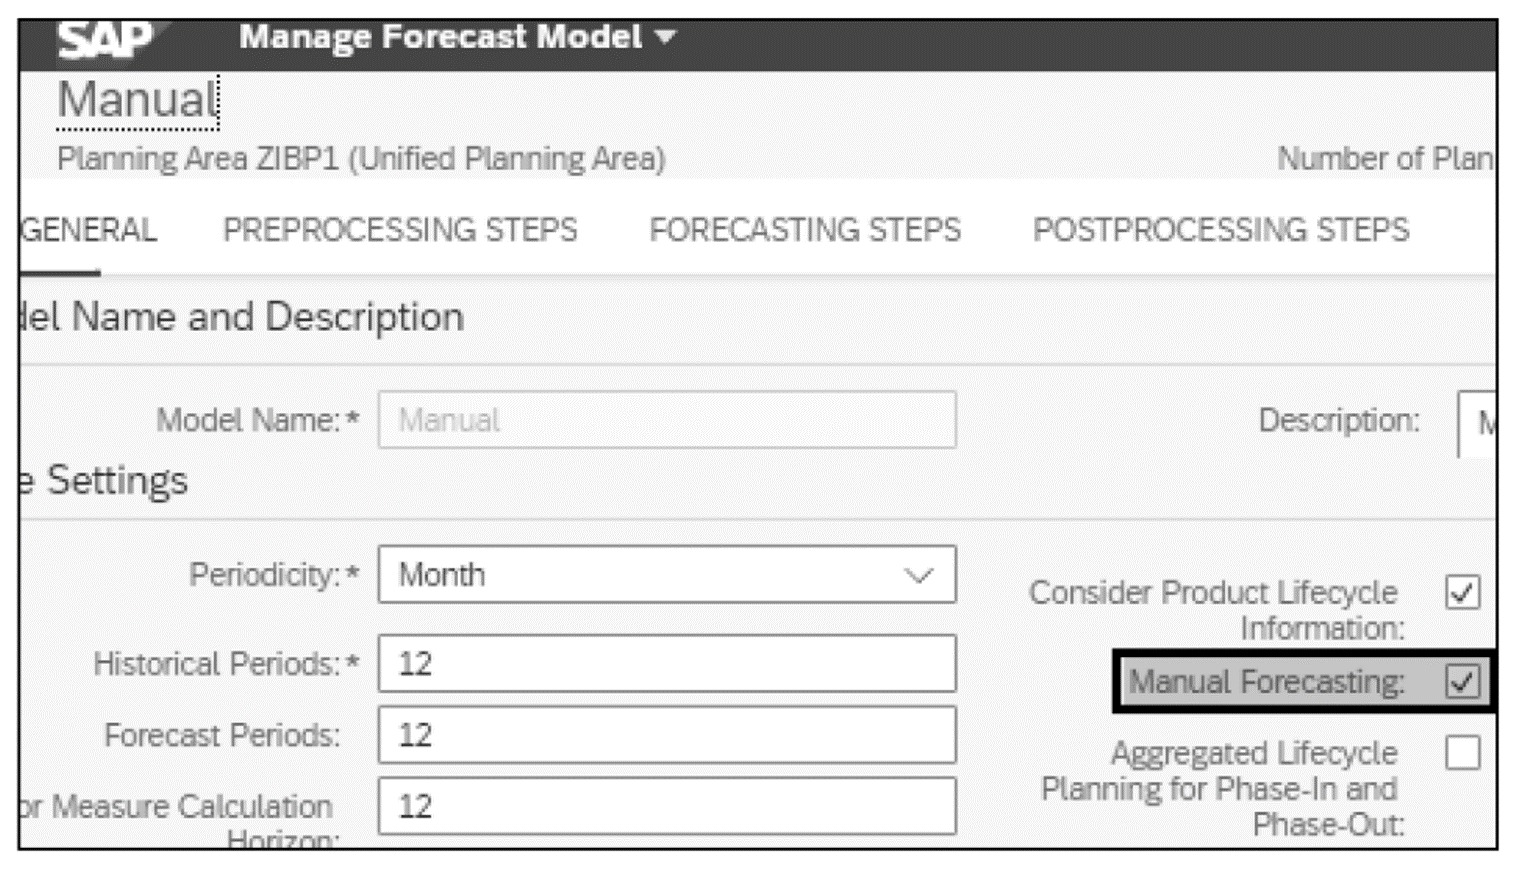
The Manual Forecasting option should be enabled in the GENERAL tab of the Manage Forecast Model app, as shown in this figure.
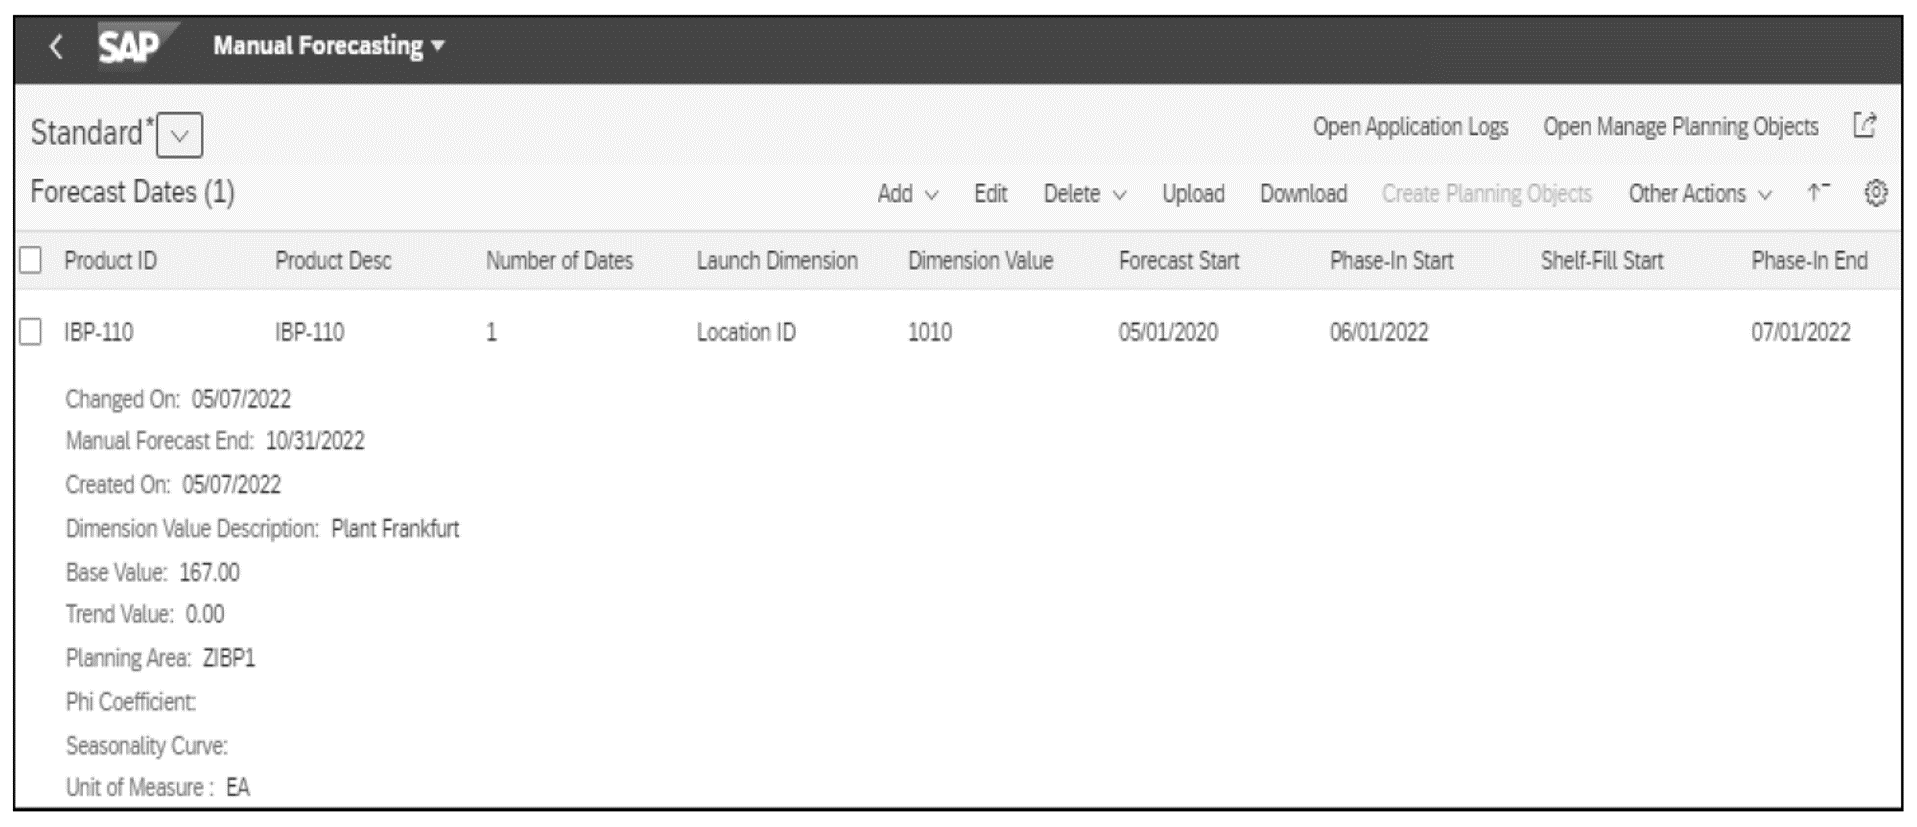
You can maintain manual forecasting settings directly in the Manual Forecasting app. Let’s consider an example of maintaining manual forecasting for product IBP-110 in location ID as the launch dimension and location ID 1010 as the launch dimension value. To access the parameters for our example, in the Manual Forecasting app, choose Add > Single Forecast Date, and enter the planning area, product ID, and launch dimension. Then the parameters of manual forecasting are as shown in the next figure:
- Shelf-Fill Start: In this optional step, you can enter a fixed value from a particular date (e.g., May 1, 2022). This date must be before the phase-in date and based on the shelf-life length.
- Shelf-Fill Length: You can enter the length of your shelf-fill period. The period is based on granularity such as week or month (e.g., 6 months).
- Shelf-Fill Value: Shelf-fill value is the overall value that you want to distribute from the shelf-life start date until the end of the shelf-fill length (e.g., May 2022 to Oct 2022).
- Forecast Start: This is the date from when the forecasting starts.
- Phase-In Start: This is the phase-in start of the new product considered in the manual forecasting. This date should only start after the shelf-life period is completed. For example, if the shelf-life starts from May 1, 2022, and the length is six months, then the phase-in can only start from November 1, 2022.
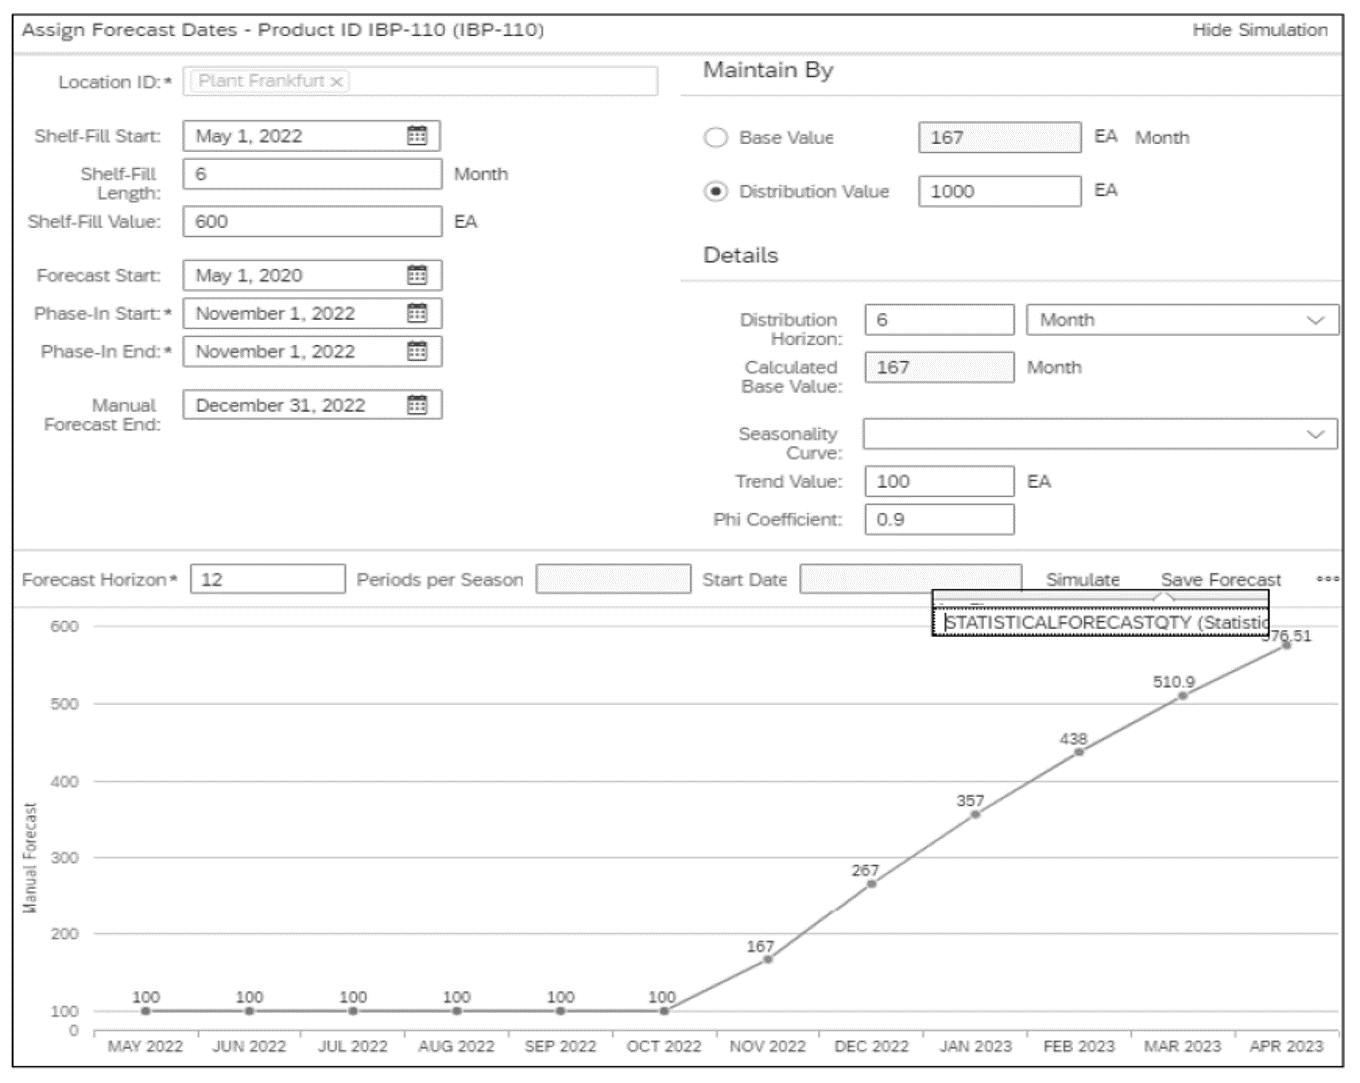
- Phase-In End: This is the end date of the phase-in period. It can be the same as the phase-in start date or different.
- Manual Forecast End: This is the date you want to keep the manual forecasting for the new product. You can extend or shorten based on the sales history of the new product.
- Base Value/Distribution Value: The seasonality and trend are calculated based on the base value/period. The distribution value is the total value that you want to distribute for the manual forecasting from the phase-in period. The base value must be greater than 0.
- Distribution Horizon: This refers to the distribution periods of the distribution value. For example, if the distribution value is 1,000 EA and this quantity is distributed over six months based on the distribution horizon, the Calculated base value = Distributed value/distributed horizon, so (1,000 / 6) = 167 EA.
- Seasonality Curve: With this optional setting, you can choose a seasonality curve if required.
- Trend Value: This optional value allows you to enter trend to potentially increase in the product sales. This value will be added to the base value of each period. For example, if your trend value is 50 pcs, base value is 100 pcs, and one forecast horizon is for 12 periods, then the forecasting will be 100, 150, 200, 250, 300 . . . 600.
- Phi Coefficient: This is used to dampen the trend (e.g., 0.9).
- Forecast Horizon: This is used to specify the forecast horizon (e.g., 12 months).
You can simulate the forecast with the parameters by clicking the Simulate button in the menu bar. Save the forecast results by clicking the Save Forecast button from the menu bar, as shown above, in any of the key figures to be used as an input for the forecast model. You can also store the forecast directly in the Statistical Forecast Qty key figure.
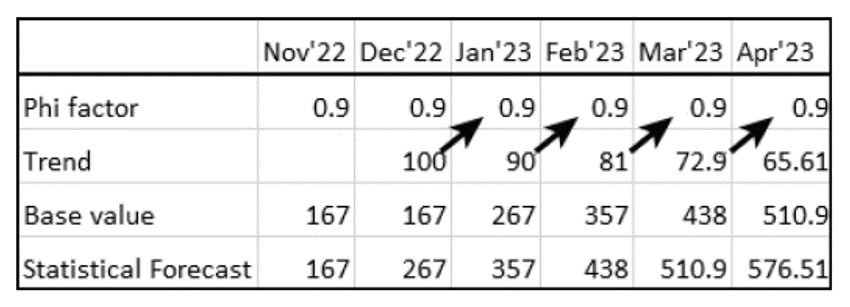
Forecast calculation can be used with and without trend dampening. The system calculates the forecast starting from the forecast start date while considering the phase-in start and end dates. Calculations of forecast with trend dampening are as follows:
Forecast = (Base value + trend) × Seasonal index
Trend = Trend value × phi factor
n = Number of periods
In the example, the total forecast horizon is 12 months with the shelf-fill period in the first six months (May 2022 to October 2022). The forecast value is calculated with trend dampening from November 2022 until the end of the manual forecast period (April 2023), as shown in this figure.
You can see the manual forecast results in the Microsoft Excel planning view without Actuals Adj. Quantity key figure and reference product. The forecast simulated value are saved in the statistical forecast quantity, as shown here.

Editor’s note: This post has been adapted from a section of the book Demand Planning with SAP IBP by Venkadesh Seetharaman.


Comments