Let’s look at the equivalent of the material price analysis for activities, known as activity consumption analysis.
You may have noticed that in SAP S/4HANA, materials and activities are treated as (almost) equivalent objects. This becomes evident when looking at the actual costing cockpit, which shows separate status columns for materials and activities. In SAP ERP, the analysis of activities was, for the most part, subsumed into the material price analysis; however, in SAP S/4HANA, activity analysis has its own Transaction CKM3A. This transaction allows you to display the activity type/business process consumption, as it’s done in Transaction CKM3 for materials.
Let’s now look at the header section of the activity consumption analysis by going to Transaction CKM3A. You’ll arrive at the screen shown in this figure.

As you can see, most of the header fields and buttons in the activity consumption analysis report are similar to those of the material price analysis. For brevity, we’ll discuss the highlighted fields that are exclusive to the activity consumption analysis:
- Cost Ctr./Act. Type: In this field, you enter the cost center and activity type that you want to analyze.
- Business Process: If you use activity-based costing, you can enter the Business Process (instead of the cost center/activity type) that you want to analyze.
- Controlling Area: This will default from the plant that you entered (because the plant is assigned to the company code which is assigned to the controlling area).
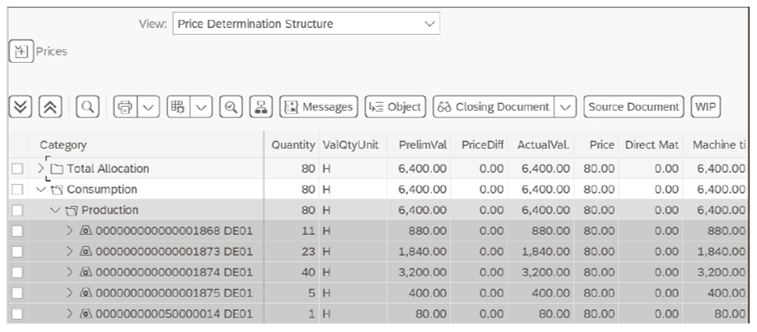
Let’s now look at the price determination structure view of the activity consumption analysis, which is shown in the below figure.

As you can see, the columns of the Price Determination Structure of the activity consumption analysis are similar to the material price analysis, being a combination of the price determination (quantity, preliminary value, price difference, actual value, and price) and the cost components (in which the machine time is populated). The rows that are shown in the price determination structure are described here:
- Total Allocation: This is the total activity quantity that has been allocated during the period. In our example, 80 hours of activity type 1 are available for allocation. These hours had a preliminary valuation of €6,400 (or €80 per hour), which represents the plan activity price, and there is no price difference because the preliminary valuation (Prelim- Val, i.e., plan price) and actual valuation (ActualVal., i.e., actual cost) are equal.
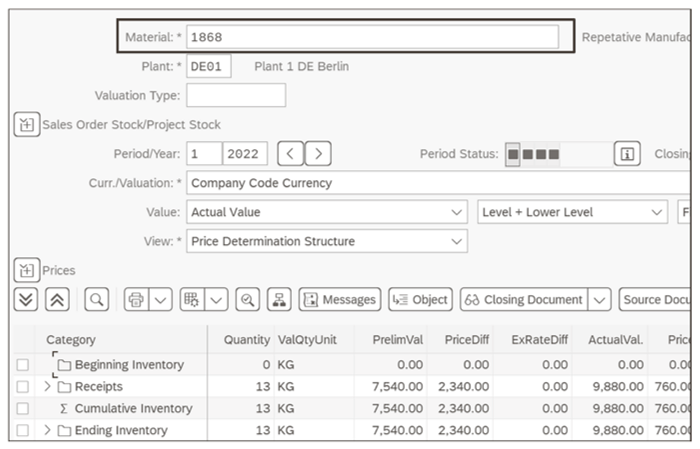
- Consumption: This shows how the allocated activity quantities were consumed. You can see that the 80 hours allocated were consumed by five materials (1868, 1873, 1874, 1875, and 50000014) in the Production category, which means that the activities were consumed by manufacturing orders used in production. (Note that, if there was a price difference for this activity, it would also be allocated proportionally to the consumed materials). Just as with the material price analysis, the activity consumption analysis allows you to navigate to various other transactions. For example, if you double-click one of the materials shown above, this will take you to the material price analysis for that material, as shown here.

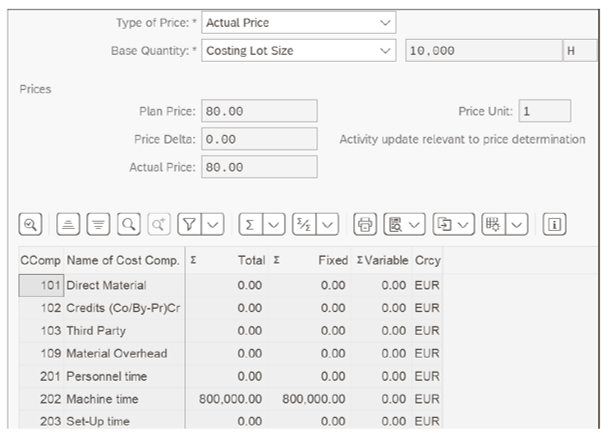
You see the Material Price Analysis screen for material 1868, which is one of the materials that the activity was consumed by. Another screen that you can also navigate to from the activity consumption analysis is the Cost Components screen. You can do so by clicking on the Cost Component Split button at the top of the activity consumption analysis screen, and you’ll be taken to the screen shown in the final figure.

The Cost Component screen shows the Actual Price (based on a Costing Lot Size of 10,000 H) split into the Fixed and Variable costs for the Machine time cost component.
Learn the Material Ledger in Our Rheinwerk Course!
Managing actual costing and parallel valuation in an increasingly globalized economy is more complex than ever. This series explains core Material Ledger concepts, capabilities, and configurations. Learn how the Material Ledger helps organizations handle inventory, exchange rates, regional legal requirements, and market fluctuations. Get access to course recordings by clicking the banner below.
Editor’s note: This post has been adapted from a section of the book Material Ledger in SAP S/4HANA: Functionality and Configuration by Paul Ovigele.


Comments