
Let’s establish a common understanding of analytics in general, which will be helpful for those looking to utilize SAP for their analytics operations.
Analytics, in short, is the process of collecting, structuring, and visualizing data for the purpose of first understanding context and meaning and then deriving action and decision from it.
The quality and significance of the data correlates with the amount of data used, the choice of suitable interpretation and visualization methods, and the use of the right technology.
According to this definition, analytics in business is mainly related to data or the databases it’s stored in, the visualization format, and the transformation processes to allow those visualization processes.
What’s the difference between this and transactional processing? This might be the wrong question because there’s no differentiation for a business process. What’s a transactional step and manipulation without the knowledge of where it should happen and without the visualization of its consequences? Do you know how to handle customers without a report on their profiles? Isn’t it important to see the results of your cost center management activities (payroll data updates, team member additions, etc.) to get an overview of the cost center and judge where you stand? Information and analyses determine our operational work and help us make better decisions.
Process-wise, we may speak about one seamless experience, but technically these two aspects of a process are separated in traditional scalable ERP system architectures such as SAP ERP 6.0 on a relational disk-spaced database. Technically, both aspects require different strengths of the system, which partly conflict.
To differentiate analytics further, analytical use cases and requirements (incomplete but exemplary) can be used by describing the requirements coming from different roles, as well as personal preferences of the end users, based on the specific level of complexity and interaction. These use cases include the following:
- Simple list
- Highly formatted report (e.g., for legal purposes)
- Multidimensional reporting (OLAP reporting to support slicing and dicing)
- KPI visualizations and drilldowns (often along predefined dimensions)—to gain attention and allow insights
- Complex overview visualizations (e.g., value-driver trees) combining dedicated visuals with numbers and highlighting via colors and other effects the cause-and effect relations
- In-place analytical applications, such as embedded spreadsheets like the all-in-one application Microsoft Excel inside of an OLAP tool
- Planning (changing, extending, and creating reported data and predefined and ad-hoc manipulation functions, such as forecasting, copy, or percentage increase) on an abstract layer independent of the transactional layer
- Simulation applications—like planning, but using dedicated complex, often even multidimensional and dynamic models
- Operational/transactional planning—for embedded data manipulation and creation along existing operational and actual data models and data to continue working with this data in transactional processes (e.g., product cost calculation based on plan values derived from actual figures)
- Decision support applications—providing analytical intelligence with context-relevant information to help with decisions
- Rule-based decision automation—using artificial intelligence based on mass information about real-life transactional user behavior for recognizing patterns and deriving suggestions about decisions (e.g., which supplier to be chosen based on former decisions)
- Exception handling—for actual guidance for what to do in the system based on highlighted KPIs and restricting the decision-relevant data to be processed within a transaction
All processes could be handled within the same platform, but technical limitations have led to a separation between a mostly transactional platform and a dedicated analytical platform (including databases, enterprise data warehouses [EDWs], analytical modeling, and visualizations using analytical applications) in the past. Technically, ERP systems such as an SAP R/3 or SAP ERP based on traditional disk-based databases are set up differently than those created for analytical processing (like SAP's EDW application SAP BW, even based on the same technical stack as SAP R/3)—for example, with a different ratio of memory to number of processors.
However, the higher the level of interaction or need for both suitable and real-time analytical information is, the higher the traffic becomes between the different system instances. At the same time, the amount of data rises dramatically. The original idea for the architecture of an ERP system based on an analytical database, which now is reality with SAP S/4HANA, provides the necessary capability to cope with these requirements.
Analytics in general is the term used for outside-in views, independent of the data sources needed. The focus is on how data is displayed to support the recognition and understanding of the data’s message. Although this is an essential requirement within business operations, reality (often influenced by educating executives accordingly) often makes executives believe they simply need to follow best practices for the definition of business-crucial KPIs (known since the development of the DuPont analysis for KPIs) and their visualizations. But the actual validity for the specific business process may be left out
Analytics is only useful if you have access to systems and applications that enable you to analyze the data and thereby measure performance to gain insights into how your business is doing. The knowledge provided should then give you the ability to learn from these findings and act accordingly and make decisions. Analytical applications are either embedded in transactional or operational systems or kept separate. The more sophisticated and complex these solutions are, the more likely is it that they are deployed as standalone visualizations on top of various data sources.
The following table shows a list of examples of the analytical use cases and the types of analytical applications they fall into, as well as related SAP example technologies or products that exist in the current SAP portfolio.
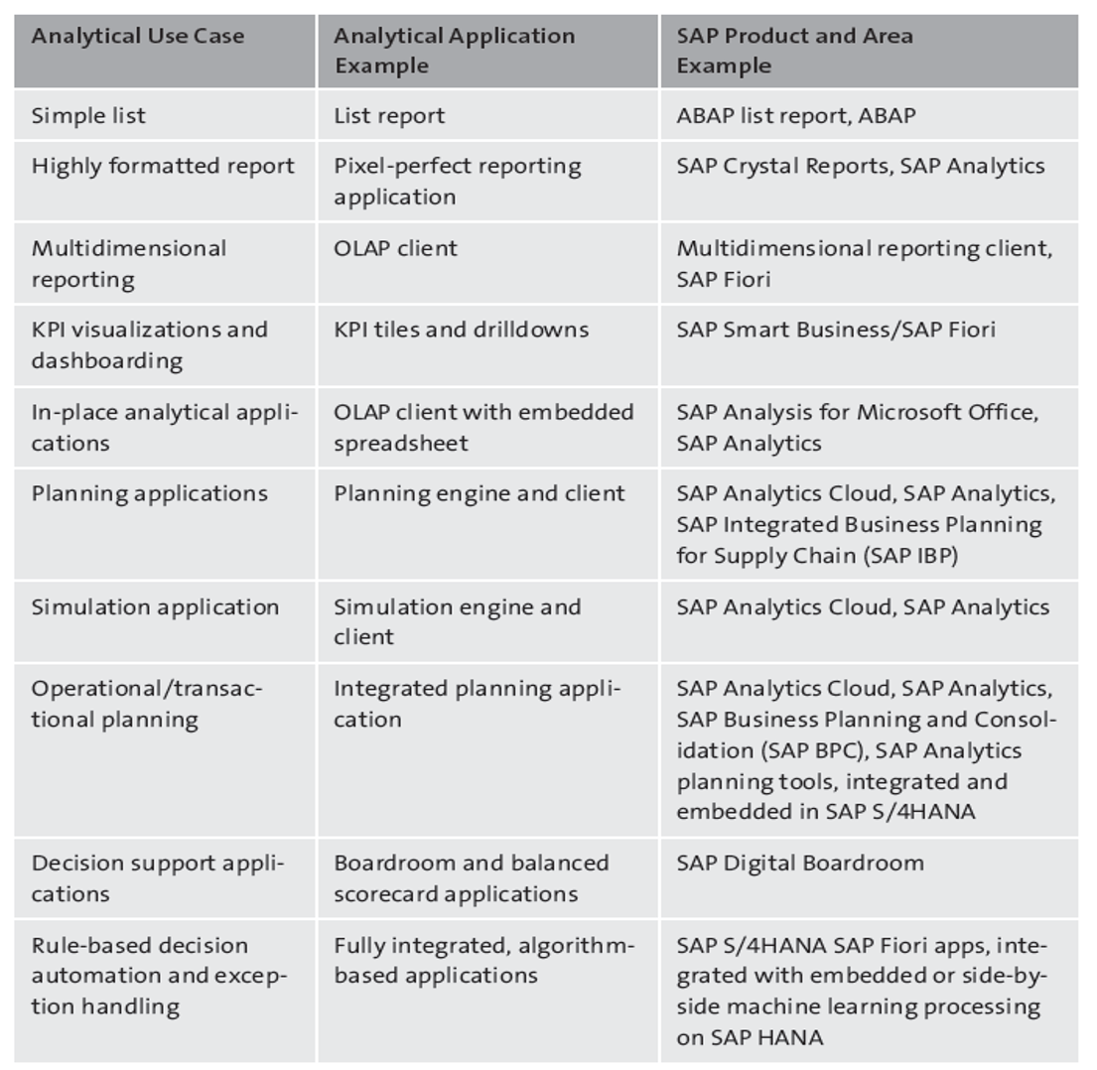
All these use cases occur in one way or another; in some cases, it’s a matter of budget, personal preference, or even a lack of knowledge leading to analytical applications being used for use cases other than those they were originally designed for.
The different types of applications fall under the cluster of business intelligence, without which it’s impossible to monitor and drive any business. The development of different solutions is also a strategic part of SAP’s portfolio. Recently, SAP has focused on a combination of SAP S/4HANA and SAP Analytics, which is the area that business intelligence applications fall under.
Editor’s note: This post has been adapted from a section of the book SAP S/4HANA Embedded Analytics: The Comprehensive Guide by Jürgen Butsmann, Thomas Fleckenstein, and Anirban Kundu.
.png?height=600&name=Embedded%20Analytics%20Content%20Delivered%20with%20SAP%20S4HANA%20(1).png)

Comments