
In this blog post, let’s walk through inserting data sources into a workbook in SAP Analysis for Microsoft Office.
To create a new workbook with a data source, SAP Analysis for Microsoft Office must be installed locally on your computer. You can either connect directly to an SAP BW system or use a connection to an SAP BusinessObjects BI platform to insert data sources. The same platforms can be used to save workbooks and share them with other users.
We’ll discuss two methods to insert data sources into a workbook. We’ll use the SAP NetWeaver platform for examples. However, you can transfer the procedure seamlessly to SAP BusinessObjects BI.
Inserting Data Sources via the Analysis Tab
To insert a data source, first, select a cell of the workbook into which the crosstab with the data should be inserted (e.g., cell B3). Then, under the Analysis tab, click on the Insert Data Source dropdown list (1) in the Data Source menu group, as shown here.
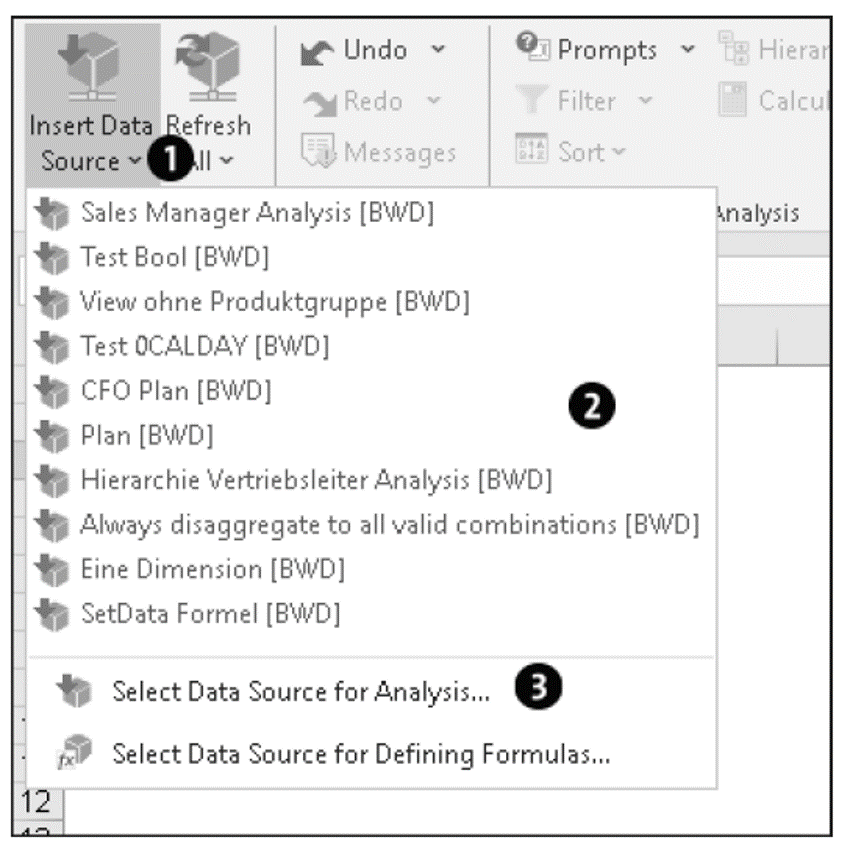
If you’ve previously used data sources, these data sources will be displayed in a list (2). You can select and insert a data source with a single click, which will speed up your work because you won’t have to search for a specific data source.
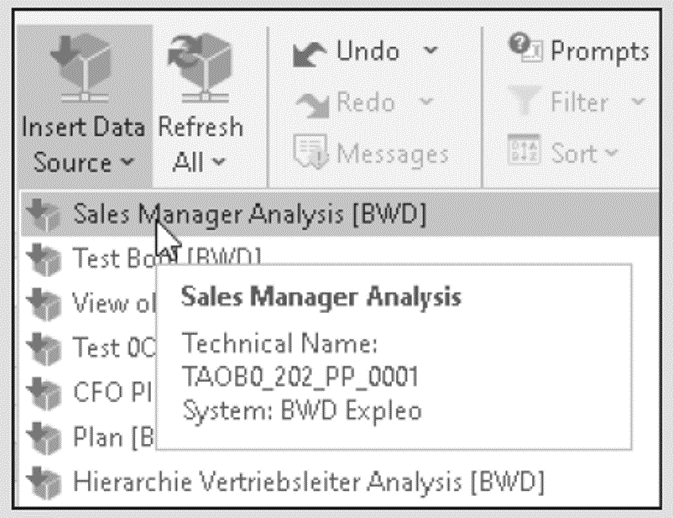
In the list of previously used data sources, only the description and the system are initially visible. Unfortunately, these descriptions are not unique. Thus, different queries with the same description can exist in one system. If you mouse over the name of the data source, the technical name of the data source is also displayed, as shown in the next figure. In contrast to the description, this name is unique. In reality, only one query has this name.
If you have not yet added any data sources or cannot find the desired data source in the list, you can select the Select Data Source for Analysis... option (3), shown earlier.
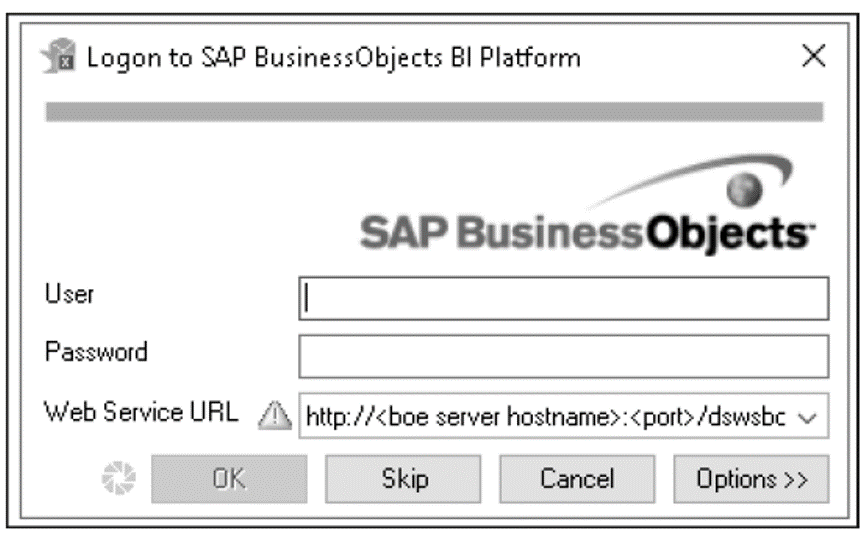
Now, by default, the dialog box for logging on to the SAP BusinessObjects BI platform opens, as shown below. If you’re using an SAP BusinessObjects BI platform, enter the relevant information into the User, Password, and Web Service URL fields to log on. If you’re using SAP NetWeaver as your platform, click the Skip button.
1
Automatically Skipping the SAP BusinessObjects BI Platform Logon Step: The dialog box for logging on to the SAP BusinessObjects BI platform appears every time you log on, even when you’re not using the system. However, this default behavior rarely makes sense since only a few companies use the platform.
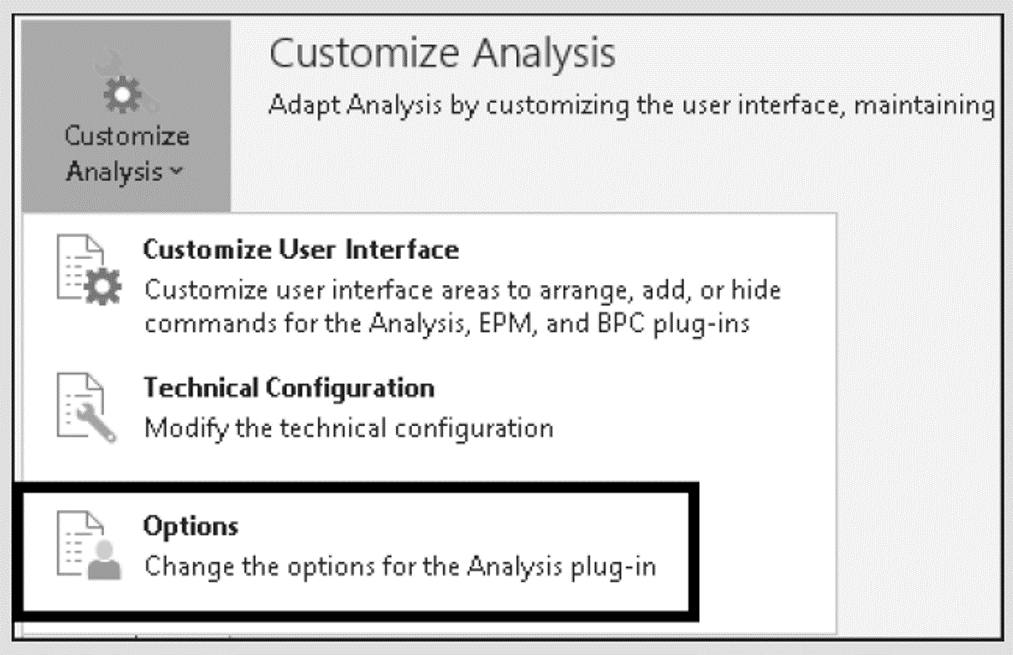
Therefore, we recommend setting SAP NetWeaver as the default platform and thus hiding the logon screen for the SAP BusinessObjects BI platform. To configure this setting, switch to the File tab, found in the upper-left corner of the screen. Then, select the Analysis option from the list, as shown here.
Then, click on the Customize Analysis option and select Options.
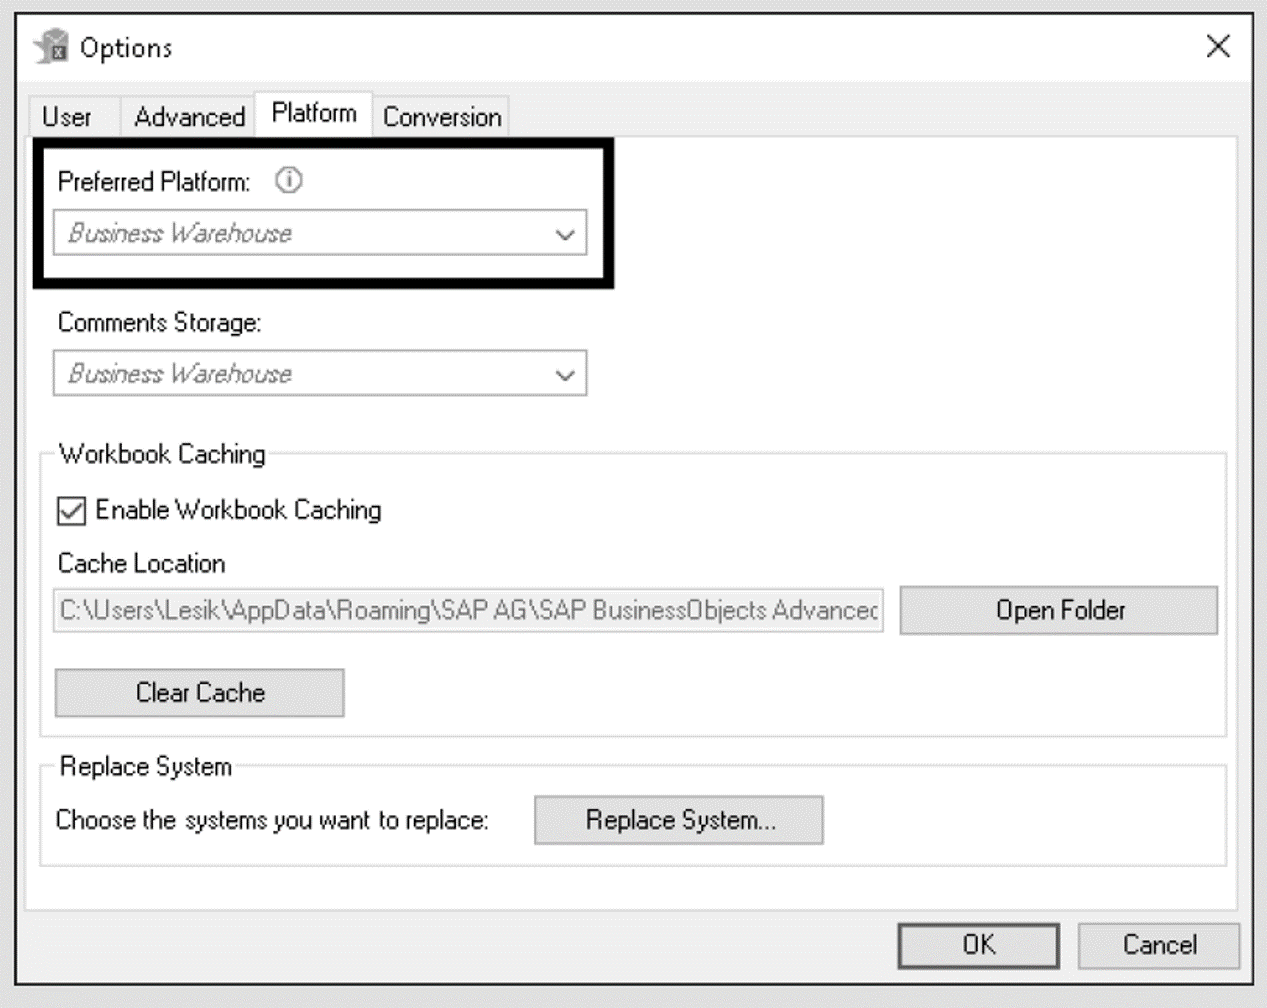
A dialog box displaying options for SAP Analysis for Microsoft Office will open. Switch to the Platform tab, shown below. Then, select the Business Warehouse option from the Preferred Platform dropdown list. Confirm the changes by clicking the OK button. Your SAP BW platform is now used by default, and you do not have to skip the logon dialog box of the SAP BusinessObjects BI platform every time.
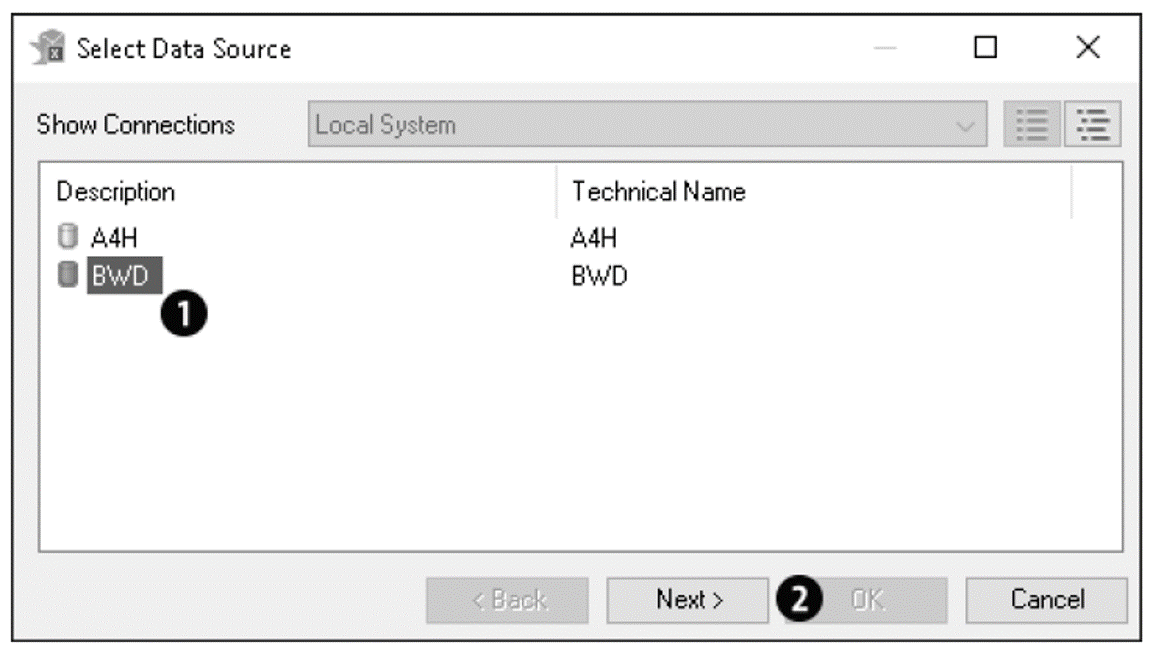
A list of SAP BW systems is now displayed, as shown in the next figure. Select the system that is relevant for you (1) and then click on the Next button (2).
The Logon to System dialog box will be displayed, shown below. Enter your user name in the User field and your password in the Password field and confirm by clicking the OK button. Optionally, you can specify a desired language in the Language field.
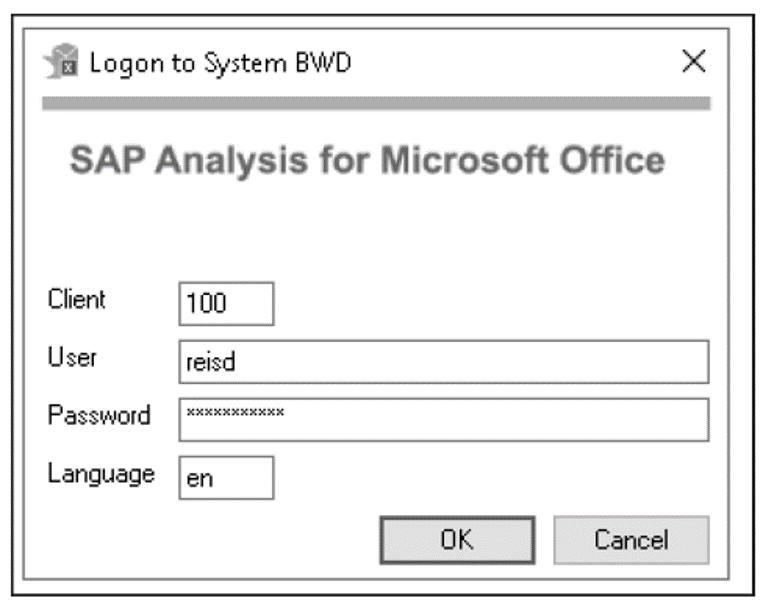
Changing Passwords: If you log on with an initial password (set up by your administrator) or your password is no longer valid, the dialog box for changing the password opens automatically. In these cases, you no longer need to log on using the SAP GUI, as was the case with earlier versions of SAP Analysis for Microsoft Office.
The Select Data Source dialog box will now be displayed, as shown in the next figure. To select a data source, you can use the Area (in this case, the InfoArea), Role, Workspaces, or Environments (SAP BPC) tabs (1). Alternatively, you can search for a specific data source using the Search tab. Use the dropdown list (2) to specify whether you want to search descriptions, technical names, or both.
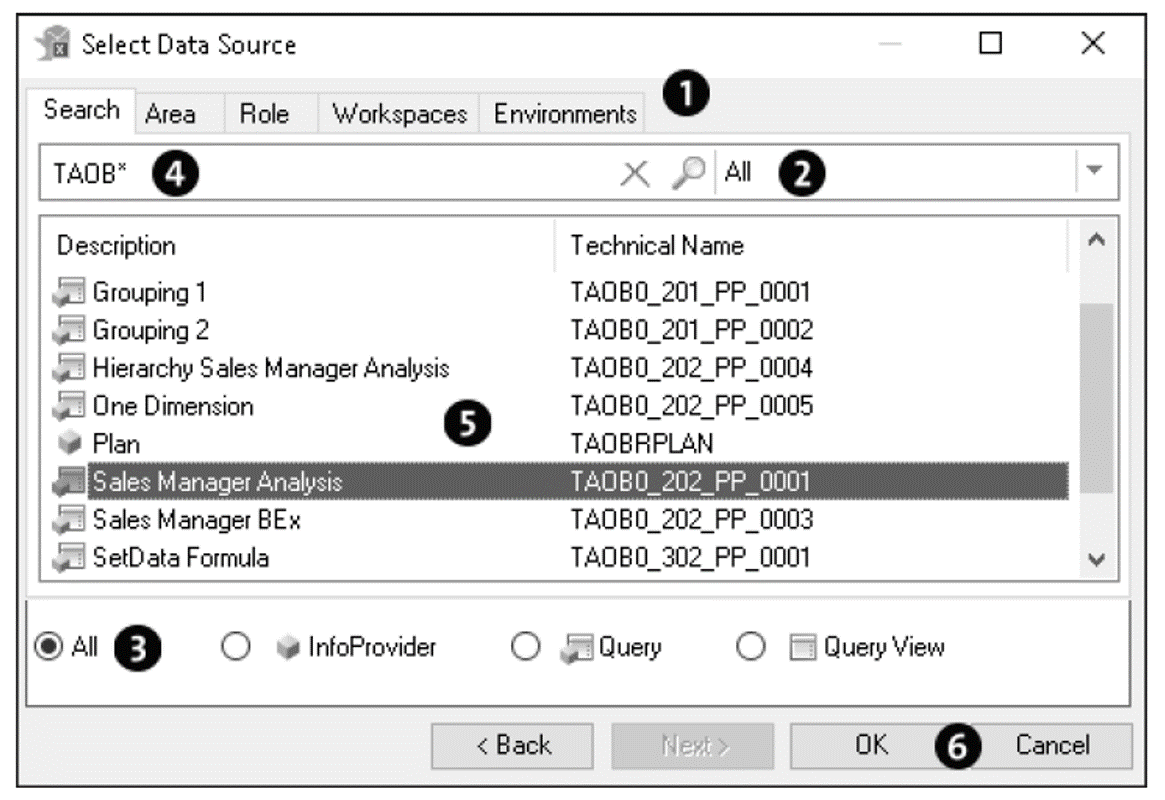
You can also restrict the data source type (3). For example, you can define that only the InfoProvider, Query, or Query View type is searched. You can also use all possible combinations for the search.
After you define the desired data source type, enter a search term in the search bar (4). Then, click the Search button or press the (Enter) key to start the search.
Wildcard Search: SAP Analysis for Microsoft Office supports wildcard searches. For example, you can type an * (asterisk) to search for data sources that begin with a specific string. For example, if you enter TAOB* in the search bar, the system will search for all data sources that begin with TAOB. In this example, the InfoProviders TAOBMCOMP, TAOBRPLAN, and TAOB0_201 and the query TAB0_201_PP_0001 might be delivered as results.
The results are displayed with a description and a technical name of each matching object (5). Select the desired data source and confirm your selection by clicking the OK button (6). A new crosstab with the data of the selected data source will be inserted into the workbook.
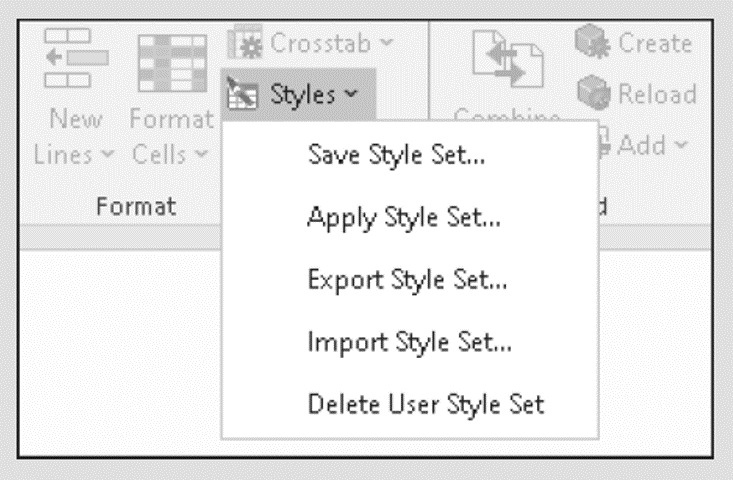
Using Styles: By default, the SAP style SAP Blue is applied to the crosstab. This style determines, for example, the size of the font and the background color of cells. You can adjust how data is displayed by selecting among several predelivered templates. To view templates, select the Styles dropdown list in the Format menu group under the Analysis Design tab and then select the Apply Style Set option, as shown in the following figure. Now, you can choose between different style sheets. Alternatively, you can also customize each cell individually or define your own styles.
Now, you can analyze the data or adjust the display to suit your needs. You can also enrich your workbook with other components, for instance, diagrams for visualization.
Faster Route to the Desired Display: You can activate the Pause Refresh function in the Design Panel menu group (under the Analysis tab) before inserting a data source, as shown here.
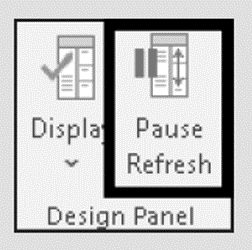
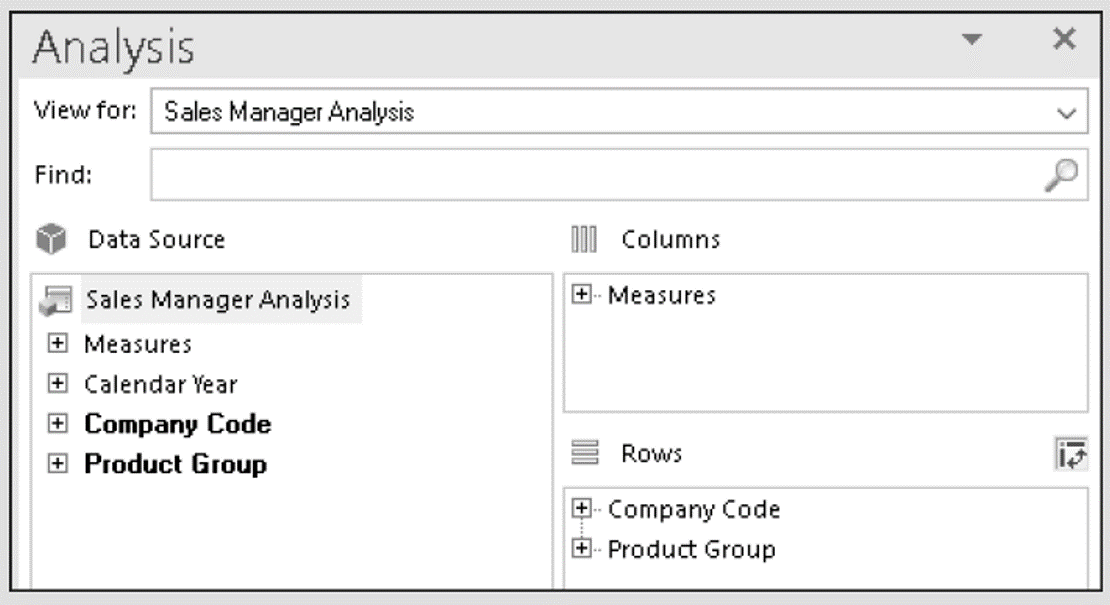
For example, you can carry out an evaluation in the Analysis view of the Design Panel without incurring loading times. You can adjust columns, rows, and filters so that only a relevant section of the data contained in the data source is displayed, as shown in this figure. Instead of first loading the entire dataset and then navigating to your desired results, only the desired information is loaded from the beginning. The crosstab with the analysis you defined is only added if you deactivate the Pause Refresh function again.
Inserting Data Sources via the File Tab
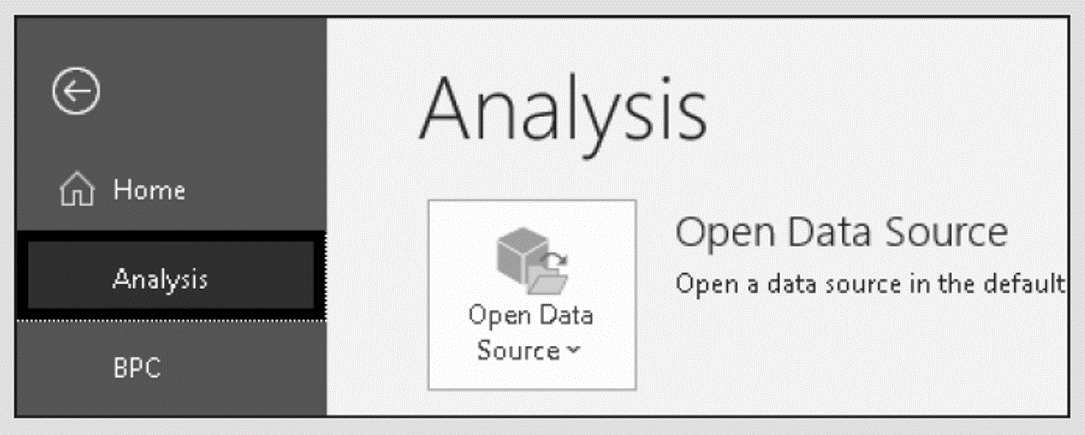
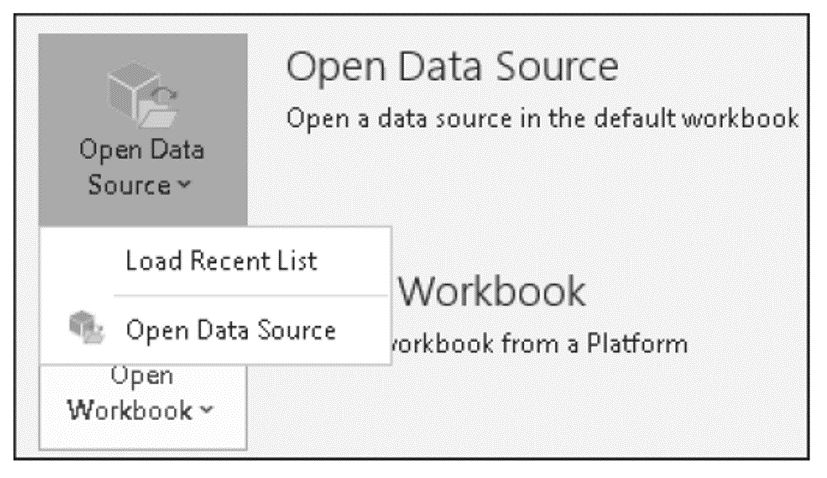
Another way to insert a data source is via the File tab. Select the Analysis option and then click on the Open Data Source dropdown list. In the dropdown list, you can select the Load Recent List option to display data sources that have been previously used. If the desired data source does not appear in the list, select the Open Data Source option, as shown here.
Then, as described earlier, you must log on to a system and select the desired data source. Afterwards, the corresponding data will be inserted into the workbook, as shown here.
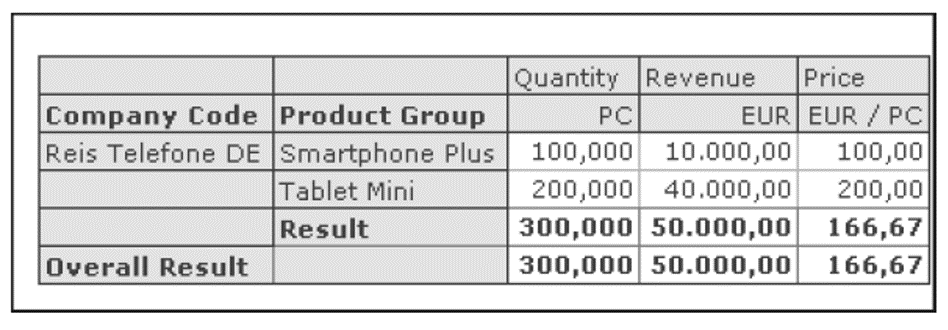
Note that this path is intended for working with so-called default workbooks. If no default workbook has been defined, the default settings will be used when the data source is opened. The crosstab will be inserted into your worksheet, starting from cell A1. The style defined as standard is also used for formatting.
Editor’s note: This post has been adapted from a section of the book SAP Analysis for Microsoft Office—Practical Guide by Denis Reis.


Comments