
Once you’ve completed an SAP Analytics Cloud story, you’re ready share and publish it. You can either use a folder structure described or publish stories outside of SAP Analytics Cloud.
In this blog post, we’ll first discuss sharing and publishing stories in general and then focus on publishing to mobile devices.
Sharing, Exporting, and Publishing Stories
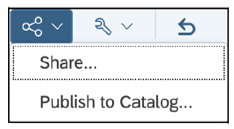
To share a story stored in your private folder or to a folder where you want to assign individual access rights, use the sharing engine of the story. Click on the Share button in the action bar of the story and select Share…, as shown here.
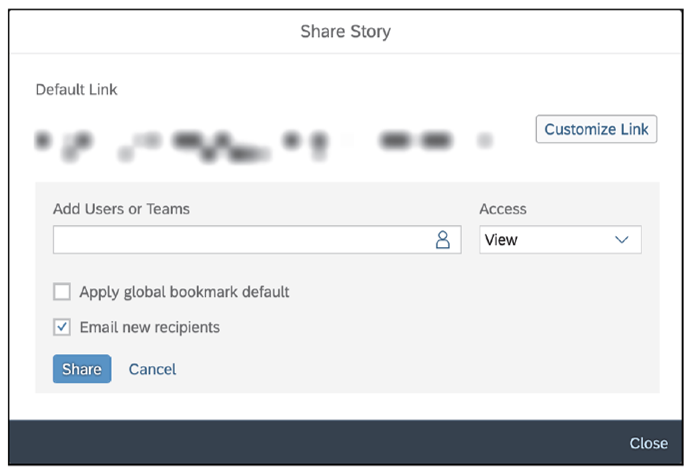
The sharing dialog box will open, as shown in the next figure, where you’ll find the story URL, which you can use to directly access the story. The URL can also be customized in this dialog box. You can also add users or teams and directly assign them story rights. In addition, you can turn off email notifications for newly added users and determine if the global bookmark should be applied by default. Users or teams must be added in this dialog box to get access to the story. Simply having the link is not sufficient for access.
In general, stories built in SAP Analytics Cloud can also be embedded into external websites. With embedding, pages can also be parameterized to set filters or prompt values while loading the page. More information on how to embed stories and which requirements must be met can be found here.
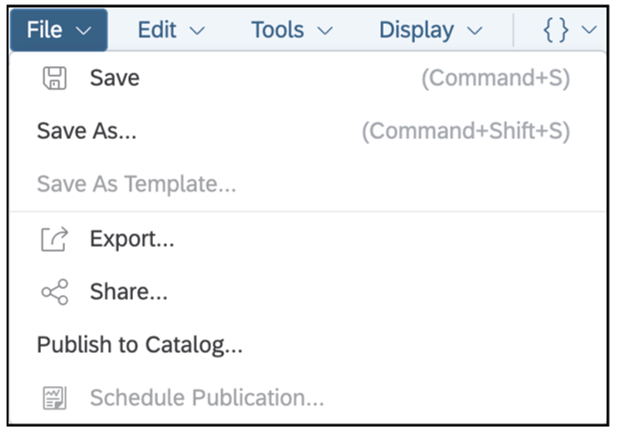
If your audience is not using SAP Analytics Cloud or you want to print out the report, you can also export the story as a PDF file. In classic mode, you can also export to a PowerPoint file or to Google Slides. However, the report will not be interactive in those formats. Click on Export… in the Save menu of the story, as shown in this figure. This option is only available in view mode.
5Figure 5.109 Exporting Stories
A dialog box will open where you can define the export settings, as shown in the following figure. Besides setting the export format, you can indicate whether all or only selected pages should be exported. If you activate background exporting, you don’t have to wait until the export is completed. The appendix, which is optional, contains a list of all filters applied in the story and the URL to access the story.
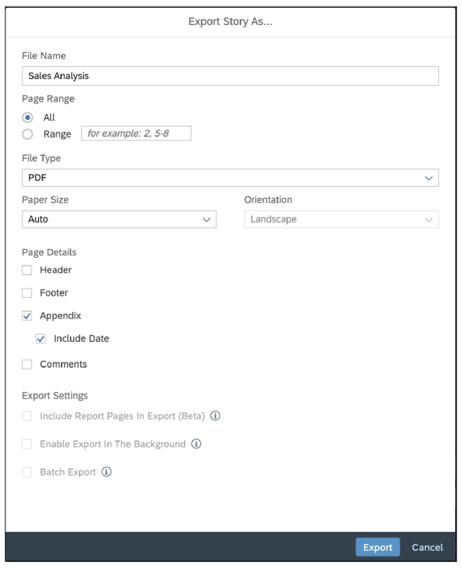
If the story contains a story filter, you can also perform batched exports. This option will use the selected story filter to create an export for each dimension member. If you use a country dimension, for example, the story can be exported for each country separately.
Sharing or exporting a story is done manually, but you can also automate the exporting process. Story export scheduling can be accessed in a story via the Files menu (Schedule Publication…) in view mode. Once selected, a dialog box lets you create one-time or recurring schedules, as shown below. The story exports can be distributed as links or as PDFs or PowerPoint files via email to a specified audience.
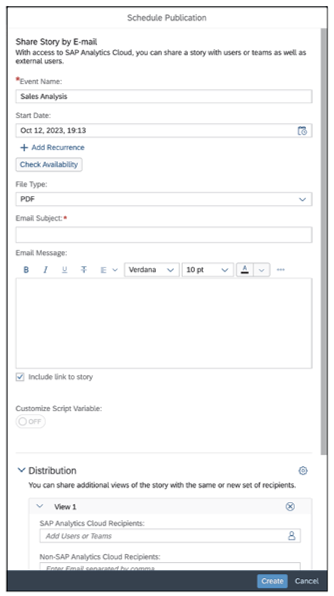
In addition, the publication process can be adjusted to apply individual filters and control authorizations.
Since the number of publications per hour is limited by SAP, users can click on Check Availability to see if scheduling slots are free within their desired timeframes.
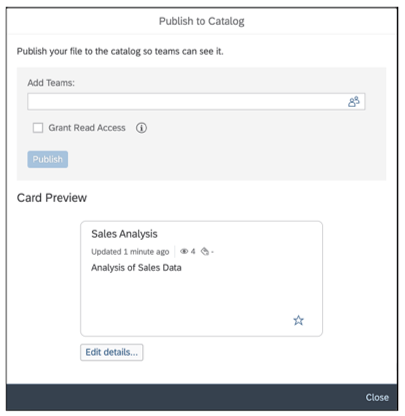
The sharing menu also includes the Publish to Catalog… option. This dialog box can be used to create an analytics catalog for SAP Analytics Cloud asset for this story, as shown in the next figure. You can control who will see this card by assigning teams. The published card will be previewed and can be customized by clicking on Edit details…. where you can modify the title and description. Screenshots, pictures, or even more links to other stories or assets can be added as well.
Publishing to Mobile Devices
SAP Analytics Cloud offers a mobile app as an alternative to the desktop version of its interface. This app is compatible with smartphones and tablets and can be installed on iOS and Android devices. You can download the app either in Google Play (for Android) or the App Store (for iOS).
To make a story accessible on a mobile device, the story must contain responsive pages. In general, a responsive page is quite similar to a canvas page. However, responsive pages use a lane concept to group and arrange content; the lanes automatically adjust themselves to the mobile device screen. Let’s create a story based on responsive pages.
To quickly convert an existing story based on canvas pages into a mobile-friendly story, you can create new responsive pages in your story. You can then either re-create the charts or use copy and paste to copy existing charts to it.
To select multiple objects at once, hold the control key down while clicking on objects. Then, copy and paste these objects to the responsive page and rearrange them as needed.
Click the device preview icon to simulate what the story looks like on a mobile device, then save the story. The mobile app will automatically show all stories that contain responsive pages and are shared with you.
We’ll create a story that contains responsive pages only. These pages provide less freedom when it comes to arranging elements.
In general, you can add the same elements to a responsive page as you can on a canvas page. The story interface is almost identical. The lane concept helps group charts, tables, and other elements and lets you choose which charts should be shown together if possible. Lanes can differ in height and width and are not limited in quantity. They can be placed to the left, to the right, on top of, and below each other.
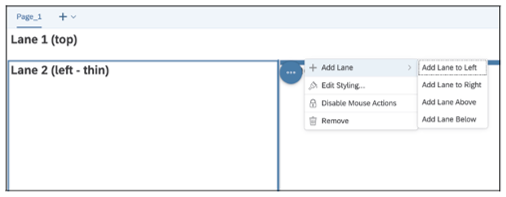
When you right-click on the header of a lane (the top strip with four dots in the middle), the lane’s context menu is shown, as shown in the next figure. With this menu, you can add new lanes, copy a lane, or remove a lane.
5
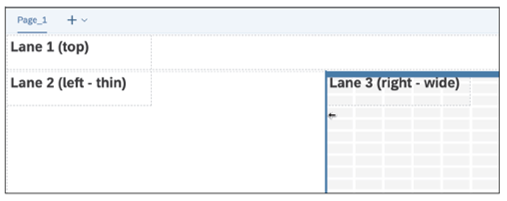
You can adjust a lane’s size by clicking on its border and holding the left mouse button down while dragging. SAP Analytics Cloud will automatically show a grid to visually support aligning lanes, as shown below. This grid is also shown when you move individual objects on the page.
Let’s create a new story and add a responsive page to it. To start, the story contains two lanes. However, we want three lanes, so we’ll add a third lane right next to the second lane by clicking on the lane header and selecting Add lane > Add lane to right, as shown earlier.
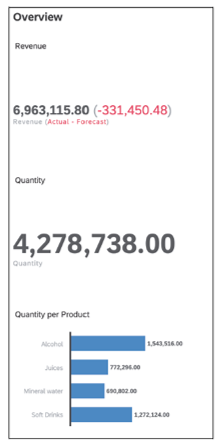
Rename the title of the first lane to “Overview.” Create the following charts, referring to the screen shown below to verify your progress:
- A numeric point chart for the Revenue Add a variance for the version dimension.
- A numeric point chart for the Quantity
- A bar/column chart for the Quantity measure and the Product
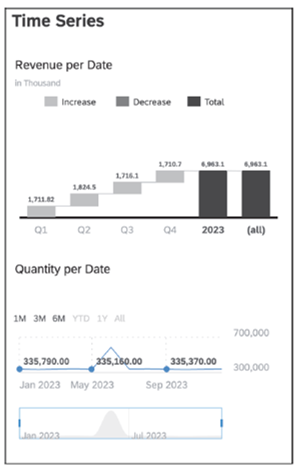
Rename the title of the second lane to “Time Series.” Create the following charts and refer to the screen shown in the next figure to verify your progress:
- A waterfall chart for the Revenue measure and the Date You may need to drill into the date hierarchy.
- A time series chart for the Quantity measure and the Date Activate the automatic forecast feature.
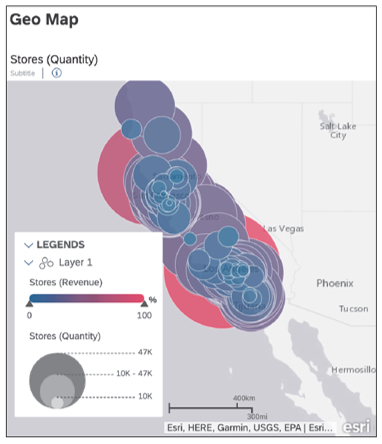
Change the title of the third lane to “Geo map.” Add a geo map and refer to the screen shown below as a template. Add a bubble layer showing the Stores dimension. Use the Revenue measure for the bubble color and Quantity for the bubble size.
Rename the whole page to “Overview.” Validate your progress against the Checkpoint 8 – Section 5.10.2.pdf file from the demo data package found on the SAP PRESS website.
Now, create a second responsive page with two lanes. Rename the page to “Detail.”
Call the first lane “Tabular Analysis” and add the following elements:
- Three input controls (filters) for the following dimensions (always add all elements):
- Product
- Supermarket
- Version
- A table with the Revenue measure and Quantity as well as the City, Supermarket, and Product
- Enable the explorer for the table and include all dimensions and measures.
Rename the title of the second lane to “Dynamic Analysis” and add the following elements to it:
- A new bar/column chart that contains a dimension and measure input control.
- The measure input control that includes the Quantity, Unit Price, and Revenue
- A dimension input control that includes the Date, Product, Street, and Supermarket
Validate your progress against the Checkpoint 9 – Section 5.10.2.pdf file from the demo data package.
Now, create a third responsive page and rename it to “More.” This page only has one lane, so remove the second lane.
Rename the lane title to “More information” and add the following elements:
- A heat map with Product on the X axis and Supermarket on the Y axis. Use the Revenue measure to determine the colors.
- A radar chart with the Revenue measure and the Supermarket Use the Product dimension for the color.
Save the story as “Sales Analysis (responsive)” in the Sales Data folder. Validate your progress against the Checkpoint 10 – Section 5.10.2.pdf file from the demo data package.
5
Finally, install the mobile application on your own smartphone or tablet. After connecting to your SAP Analytics Cloud tenant, open the story and explore it.
Learn SAP Analytics Cloud in Our Rheinwerk Course!
Master SAP Analytics Cloud! Learn how to connect and model data, create visualizations, work with planning models, and use predictive analytics. This five-day course provides a comprehensive introduction to the core capabilities of SAP Analytics Cloud and its all-in-one BI functionality. Get access to course recordings by clicking the banner below.

Editor’s note: This post has been adapted from a section of the book SAP Analytics Cloud by Abassin Sidiq.


Comments