
The SAP Prediction Library has several functions for machine learning.
The advantage of this SAP HANA library is that it is built into the database, relieving the need to migrate huge amounts of data from outside systems or use third-party big data and machine learning software tools.
The SAP HANA Predictive Analysis Library (PAL) has functions to analyze regression, time series, and social networks. An example could be the material forecast of production based on the demand. In this blog post, we are going to use the clustering function and k-means to find sales market segments to improve the revenue strategy.
You can further read the details of the implementation in my E-Bite Data Segmentation Using K-Means and SAP HANA PAL.
Sales Market Segmentation with the K-Means Function
We need to divide our market into different categories to apply a specific strategy and improve the revenue for each of these categories. The idea is to segment the clients into groups with common characteristics. For example: income, education, region, and consumer habits.
The group segmentation requires advanced tools because of the characteristics of each group. Variables include sales, quantity, customer’s credit qualification, repeat purchases, and location.
Segmentation demands compact group data. Also, we must identify the outliers that have outstanding behavior and need a special strategy. Consider the following figure: we have two group segmentation variables: gross sales compared with the quantity of sold products. The group segmentation uses a function of PAL. The function returns the optimal number of groups, the centers of each group, and the classification.
Below, we see that the optimal number of segments is two. The center of the chart, for group one (in red), focuses around the coordinates of sales 4000 and quantity 45. The upper value is sales 7000 and quantity 55. And the lower value is in sales 1500 and quantity 20.
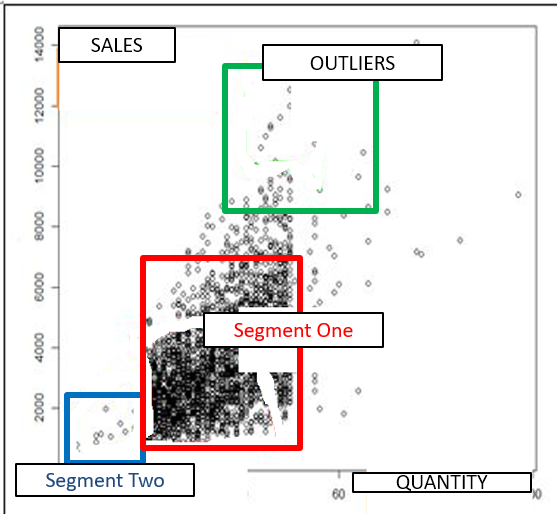
Segment 2 can be found in the blue square, which centers around sales 1500 and quantity 12. The upper value is sales 2200 and quantity 20, and the lower value is sales 800 and quantity 5.
The outliers are in the green square.
We can conclude that our sales revenue is directly proportional to the product quantity we sold in both groups. With this in mind, we can determine a strategy to increase sales (and by extension, revenue). We can include our analysis of the customer or client ID variable in a three-variable data chart, which is done in the figure below.
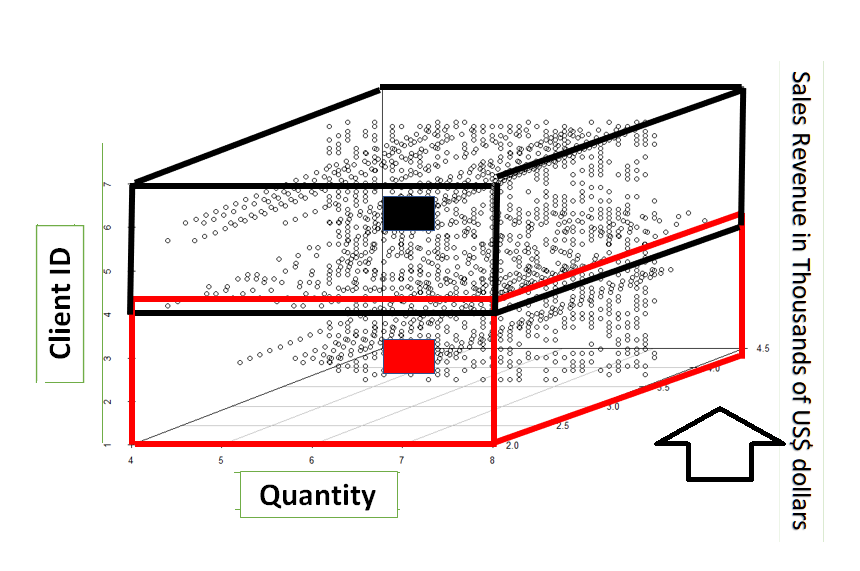
Segment one is displayed in the red section, while segment two is displayed in the black section. The centers for both are denoted by the red and black rectangles.
The SAP Prediction Library k-means function returns two as the optimal number of groups for this case.
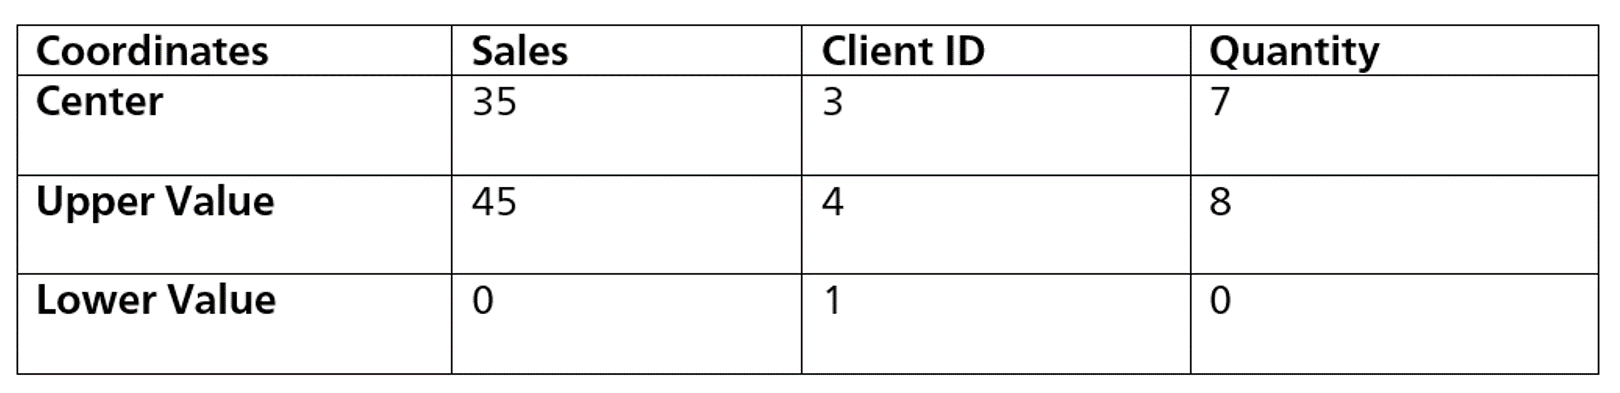
Here’s a breakdown of group number one, found in the red rectangle.
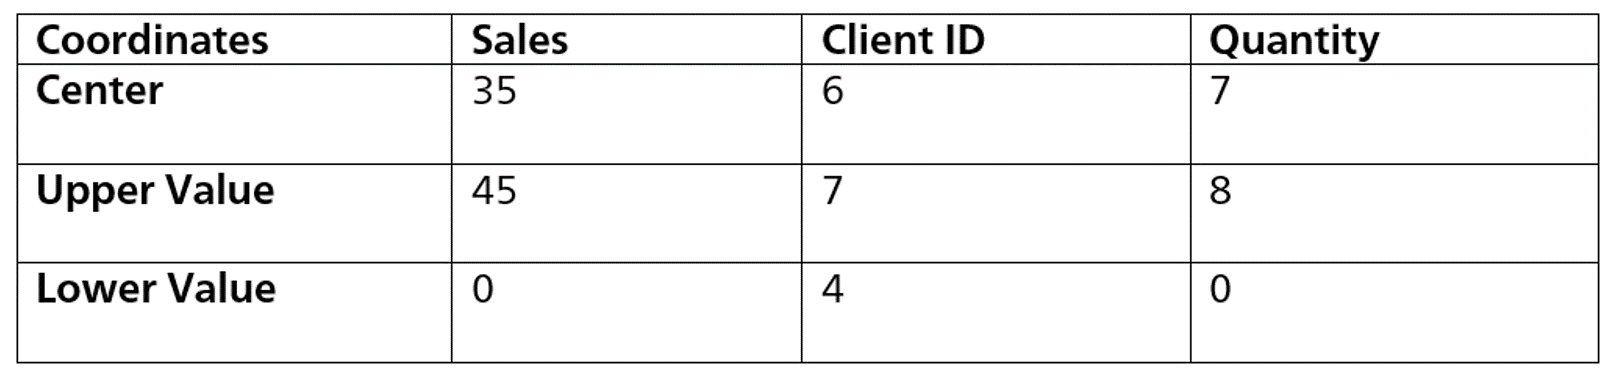
And group number two, in the black rectangle.
The Client ID is on the vertical axis (Y-axis). The clients' ID in this analysis are 1, 2, 3, 4, 5, 6, and 7. We see in the red rectangle for segment one the sales for the clients with IDs 1, 2, 3, and 4. The black rectangle for segment two has the client ID 5, 6, and 7.
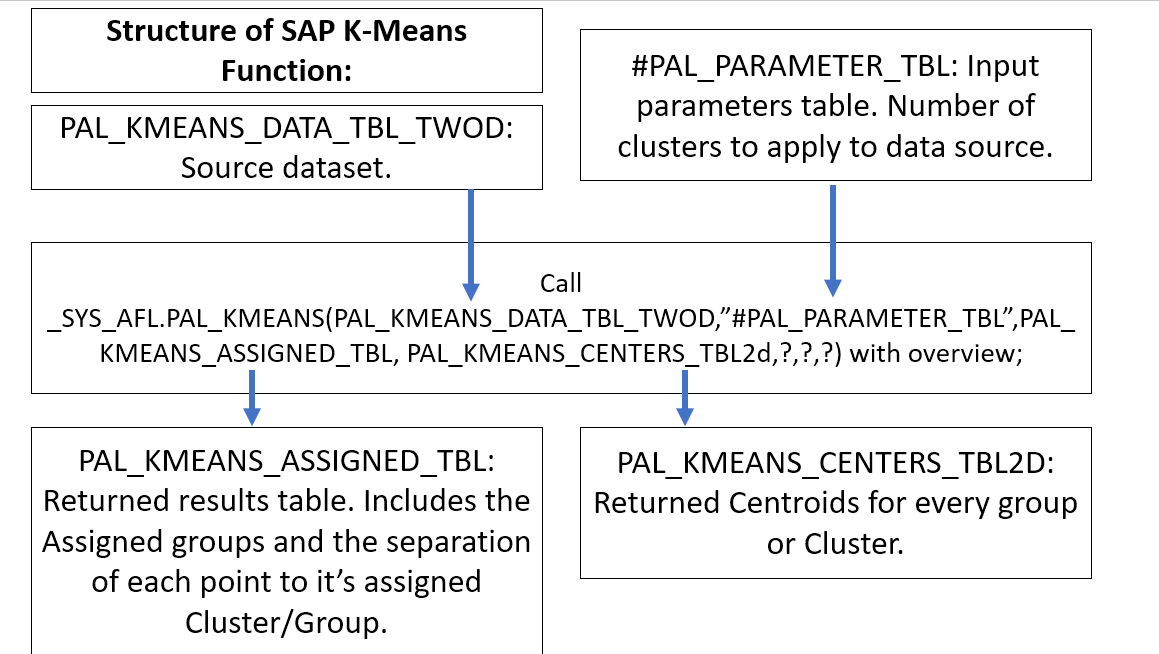
The K-Means Function of PAL
The k-means function represents input values: A) the data source table to segment and grouping and B) the name of the tables that store the returned values of group centers and the group classification. The returned values are the group centers and the segment classification.
The k-means function has this syntax:
Segmenting Data Using SAP API Business Hub
We saw an example of sales segmentation using the sales revenue, quantity of units of sold products, and customers above.
Using the REST API of SAP S/4HANA we can do segmentation research for sales and products. The storage for sales and product ITEMS is in the SAP S/4HANA tables as a master-detail relationship. To test, you can use the SAP API Business Hub, which can be accessed here: https://api.sap.com/
Here are the master detail tables of SAP S/4HANA:
Sales Order -> Master
Primary key: sales order number. Keeps the customer information.
Sales Item -> Detail
Foreign key to the Master Sales table.
Sales Order Number
Keeps the quantity, price and total paid for each ITEM of the Sales Order.
Use the CURL tool to execute the SAP S/4HANA Rest API to get the sales order with the following code:
curl --request GET --url "https://sandbox.api.sap.com/s4hanacloud/sap/opu/odata/sap/API_SALES_ORDER_SRV/A_SalesOrder?%24top=1" --header "APIKey: <your API KEY>" --header "Accept: application/json" --header "Content-Type: application/json"
Your API KEY is the key permission to execute instruction in the SAP S/4HANA Business Hub. To get the ITEMS related with the sales order number 1, execute the following code with CURL.
curl --request GET --url "https://sandbox.api.sap.com/s4hanacloud/sap/opu/odata/sap/API_SALES_ORDER_SRV/A_SalesOrder('1')/to_Item" --header "APIKey: <your API KEY>" --header "Accept: application/json" --header "Content-Type: application/json"
Look at the columns of both tables and review the candidates for the segment analysis.
Master of Sales Order
SalesOrganization
-DistributionChannel
-SoldToParty
-CustomerPurchaseOrderDate
SalesOrderDate:/Date(1471392000000)/
TotalNetAmount
TransactionCurrency
DETAIL of the Sales Order:
SalesOrderItemCategory
SalesOrderItemText: PurchaseOrderByCustomer:
Material:
RequestedQuantity:
RequestedQuantityUnit:
ItemGrossWeight:
ItemNetWeight:
ItemWeightUnit:
ItemVolume:
ItemVolumeUnit
TransactionCurrency
NetAmount:
MaterialGroup:
MaterialPricingGroup:Batch
ProductionPlant:
StorageLocation:
Conclusion:
Getting the data of sales and items sold from SAP S/4HANA, and analyzing the group segmentation with PAL shows the full power of SAP HANA. The research of the business data with the k-means happens inside the database. There is no need to batch export data to third-party tools.
The segmentation of sales tells how different the groups of clients are, and their consumption habits based on location and season. With group analysis, we can design specific strategies to improve revenue in our business.
This post was originally published 8/2020.


Comments