
Algorithms comes in all shapes and sizes; for those who want to utilize machine learning algorithms with SAP, there are multiple options. Here are eight of the most common.
1 Linear Regression
One of the earliest and simplest forms of machine learning is linear regression, a statistical algorithm to determine the relationship between a set of variables. For example, for a supermarket, you can provide the sales quantities of a brand of pancakes and then possible explanatory variables like day of the week, store discounts, and last week’s sales. The computer will simply try to form a mathematical equation to determine the relationship between the variables. Using this equation, you can determine future sales quantities.
2 AutoRegressive Integrated Moving Average
As interest developed in AI, different algorithms were developed to tackle specific real-life problems. ARIMA was developed to tackle time series forecasting problems. A time series is formed when a quantity is recorded successively with the same time interval, for instance, retail sales or stock price predictions. ARIMA can discover the relationships between different parts of a time series, for example, the week-to-week impact of the mango season on sales, using history from previous years.
You may ask why you should use machine learning when ARIMA can already solve this forecasting problem. The difference is that machine learning can capture non-linear relationships and enjoys other significant advantages over ARIMA.
3 Naive Bayes
This classification algorithm is used for binary or multiclass classification. The reason for using the word “naive” is that this algorithm assumes that the input variables or features are not correlated. Two data columns are said to be correlated if changes in one affects the other.
In real life, this assumption is rarely true. When the input data itself is correlated, the data is said to have multicollinearity. In statistics, several remedies are available for this issue.
4 Monte Carlo
Monte Carlo algorithms are a broad set of algorithms that use randomness to estimate the value of unknown parameters. These algorithms are well suited for scenarios where the inputs feature a high level of variability, for instance, projecting the profit for a company for the next quarter. These algorithms provide several advantages over deterministic or single point solutions and are used in a diverse number of fields—risk analysis in finance, energy, medicine, manufacturing, etc. Some of the salient features of this technique are as follows:
Probability Analysis
By doing a random walk over all the possibilities, not only can a Monte Carlo simulation show all the possible outcomes but can also provide probabilities for each occurrence.
Sensitivity Analysis
In terms of sensitivity analysis, by randomly picking the values of each input based on separate distributions, a Monte Carlo simulation can detect which input variables have the strongest effects on the outcomes.
Relationship Modeling
Correlations between input variables often cause issues during analysis. In a Monte Carlo simulation, these relationships can still be modeled.
5 K-Means
Assuming you have unlabeled data to analyze, k-means algorithms will identify k number of clusters, based on the similarity of the features or input columns. All data points will be iteratively assigned to one of the k groups. The result would show where the centers of the different groups exist. These differences can then be used to label the data.
6 Support Vector Machines
A support vector machine (SVM) is also a classification algorithm like naive Bayes. However, the method an SVM uses to segregate the data is quite different. Given a set of labeled data, an SVM seeks to find a hyperplane in ndimensional space that can separate the given data points. Further, this method will try to keep maximum distance between the data points from the different classes, which ensures that future/unseen data points can be classified with ease. The algorithm is relatively simple and does not require significant processing power.
7 Apriori
When you shop, you may buy different sets of goods depending on our needs. Your choices could be impacted by your wealth, marital status, mood, and so on. If a retailer can work out which products are sold together, then it can plan promotions and take other steps to increase sales, for example, by placing two or three products closer together or advertising the first product where the second product is being sold.
Apriori algorithms fall under the umbrella term market basket analysis or affinity analysis. These algorithms work out the association rule between products to uncover which are related. This data can be further analyzed to see which products are substitutes of each other, which would help the store optimize limited shelf space and even introduce higher-margin products.
Similarly, recommendation systems attempt to determine users’ preferences for a certain item. In a retail store, if someone just selected eggs, bread could be recommended. Apriori algorithms find the associations that are central to making accurate recommendations. Some features of apriori algorithms are as follows:
Associative Filtering
This kind of filtering is concerned with the items in individual baskets across all shopping sessions. The objective is to find the associations between these selected items.
Collaborative Filtering
This kind of filtering gathers information from the ratings given by a user and also looks at the ratings provided by other similar users. Combining this information, the algorithm can predict which movies, songs, etc. a user might be interested in.
Content-Based Filtering
This kind of filtering is utilized during a cold start, when data exists for use in collaborative filtering. In this case, the attributes of the products are compared with the user’s preferences to determine which products the user might want.
8 Decision Trees
A decision tree algorithm does not use equations or the other methods that we’ve discussed so far. This algorithm uses a novel approach to find which features or columns in the input data are most important in determining the output.
In a decision tree structure, the most important attributes will be at the top, and the remaining nodes will be below, in decreasing order of importance, as shown in the figure below. At each branch, the algorithm has a chance to branch further, based on the value of the relevant feature. Thus, decision trees have the following properties:
- Decision trees are a series of decisions taken on significant contributing features.
- Decision trees are a great way of checking the significance of each input variable to the final output.
- Decision trees are graphical and thus easier to interpret than neural networks.
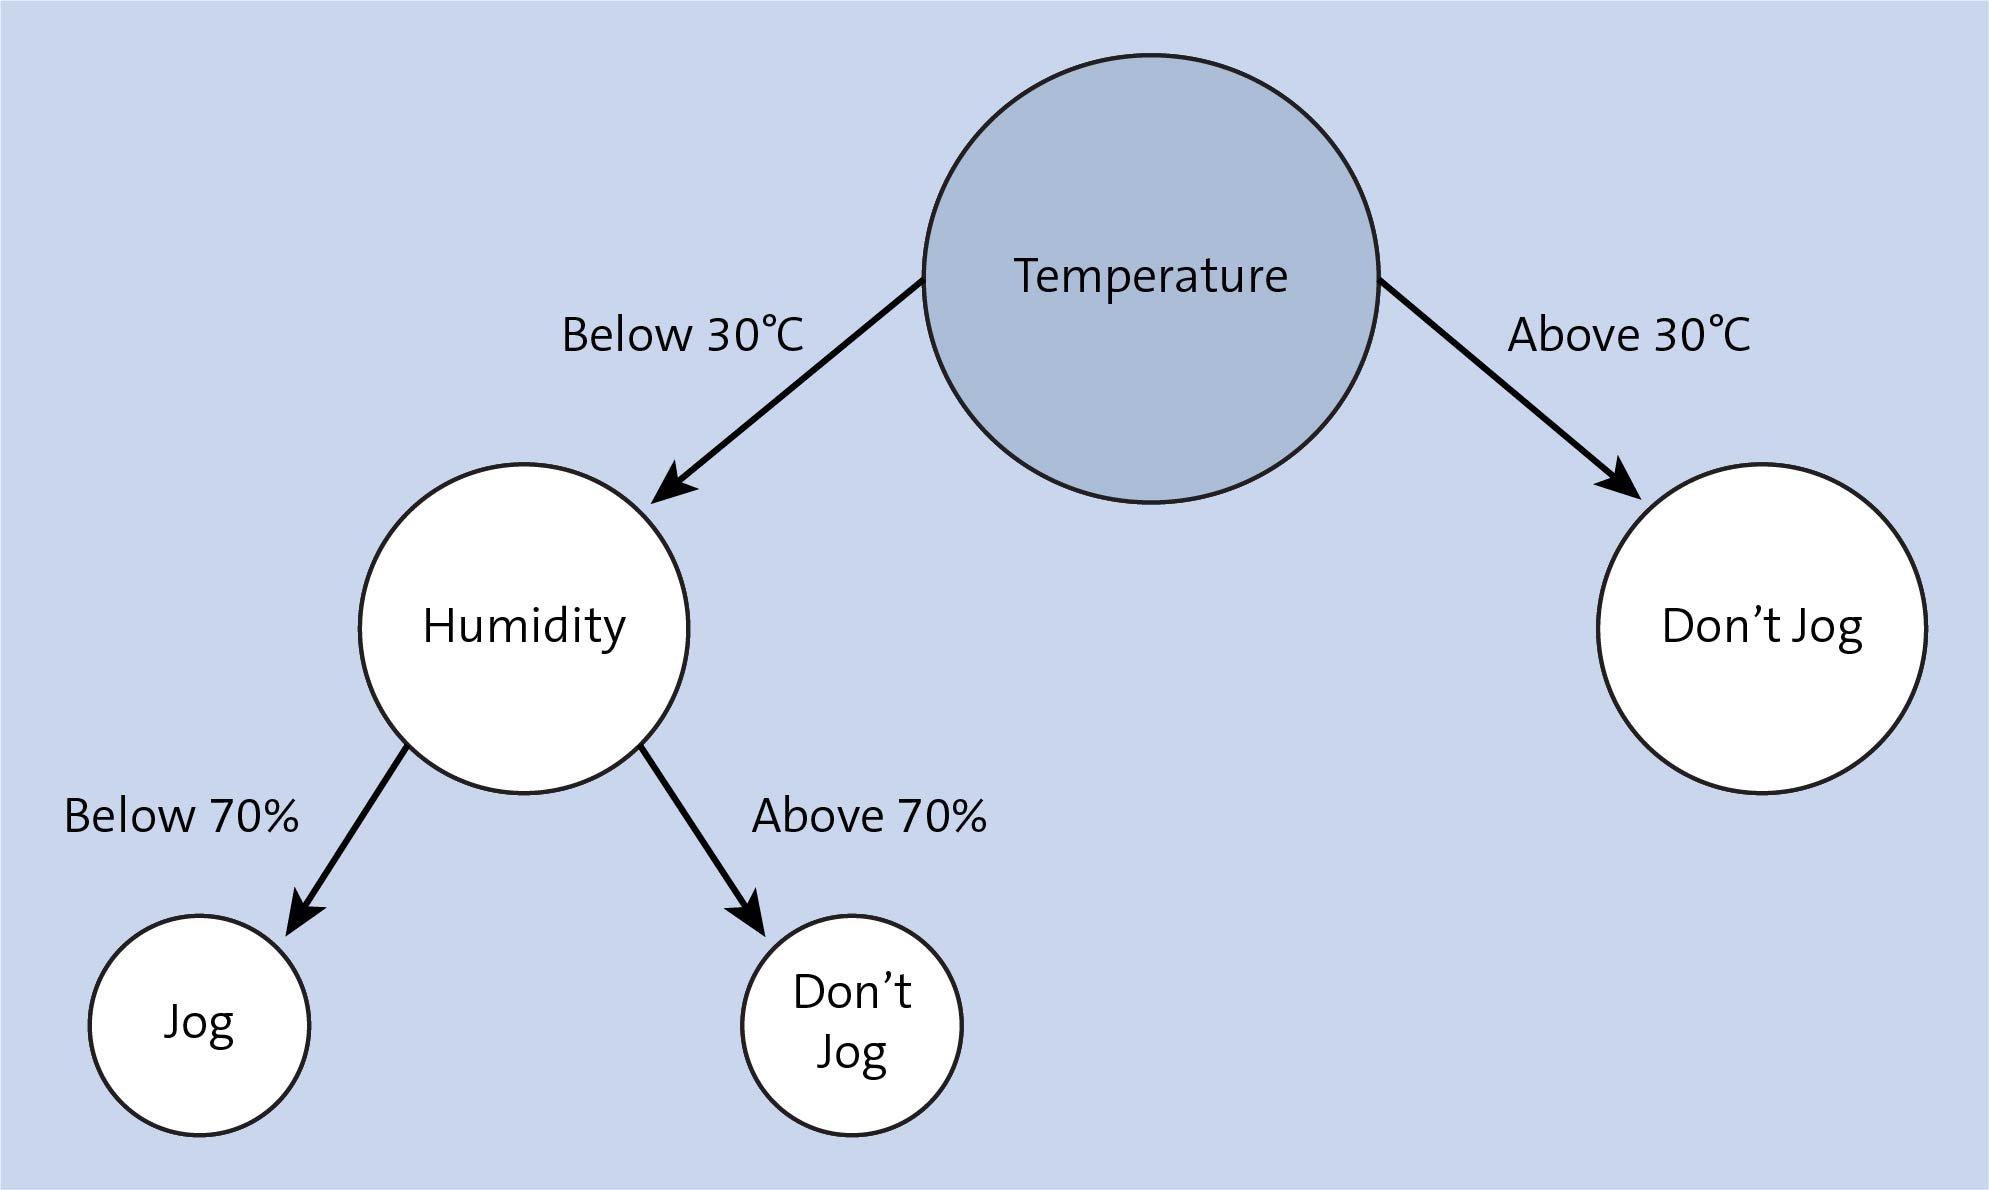
To understand decision trees, you must first learn about entropy, a concept that measures the amount of randomness in data. If your data is homogenous, entropy is said to be zero. If a mix of different data exists in the sample, then entropy tends towards 1.
For decision trees, a given dataset is split on different features. After each split, the change in entropy is measured (also called information gain). This value allows the algorithm to determine which splits provide the maximum decrease in entropy and are thus the most important.
Ensemble learning refers to combining multiple algorithms to generate a better output, based on the idea that no single algorithm could match the accuracy of the combined output. Decision trees come in several flavors. The two most commonly found ones are as follows:
Random Forests (RFs)
These decision trees use ensemble learning, with each model in the ensemble having equal voting weight. To avoid overfitting, RF trees are trained using a random set of the training data, which is referred to as bagging. RF trees combine bagging with random decision trees to further control overfitting, to improve model accuracy.
In bagging/bootstrap aggregation, a number of random samples are taken from the input data with replacement. Multiple decision trees are trained using these samples, and an average of their prediction results is used as the final output. Random Forests go a step further and take a random sample of the input features as well, which reduces model variance.
Gradient-Boosted Decision Trees (GBDTs)
In these decision trees, the boosting technique, rather than the bagging technique, is used. In boosting, a group of weak learners (algorithms) are converted to strong learners. For example, let’s say we have five rules to mark an email as “spam.” Each rule on its own is weak and could easily mistake a normal email as spam.
However, combining these rules in different ways may yield much more accurate results. This iterative process involves using the boosting algorithm to minimize errors at each step; each successive iteration focuses on the remaining error and so on, thereby creating an ensemble of weak prediction models that ultimately yield an accurate output.
Conclusion
In order to make smarter business decisions, many organizations are turning to data management tools like machine learning algorithms to identify patterns and maximize data. Those utilizing machine learning with SAP have numerous options to choose from; this blog post introduced you to eight different algorithms that can be used.
Learn more about SAP's intelligent technologies in this overview. And for even more information on machine learning with SAP, check out this post on 76 SAP HANA PAL algorithms to utilize.
Editor’s note: This post has been adapted from a section of the e-book Implementing Machine Learning with SAP HANA by Adeel Hashmi.


Comments