
Unfortunately, at the end of every IT project there is little budget left for training. After a new tool has been introduced, the users are left alone to figure out how to work with it.
These 18 helpful SAP Analysis for Microsoft Office tricks will make your work easier:
- Free characteristics
- Filtering
- Unhide columns
- Repeat members
- Display keys
- Hide or show totals
- Sort
- Change prompt values
- Use value help
- Add line in prompt
- Add lines using filter by member
- Explicit selection
- Copy prompt selections from Excel
- Show master data in the value help
- Save variant
- To previous saved state
- To previous consistent client state
- Disable reset
Some are basic, others more sophisticated—but they all are meant to kickstart your SAP Analysis for Microsoft Office usage. With them, you can make the most of your reports and get the insights required to succeed in your job.
1 Free Characteristics
To this day, I am surprised most users are not taught this basic feature. Free characteristics enable you to enhance your analysis, go into more detail, and get new insights from your data.
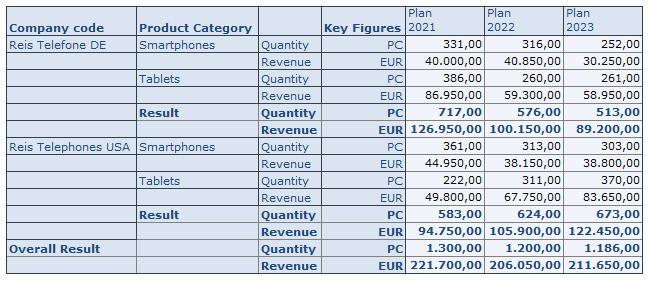
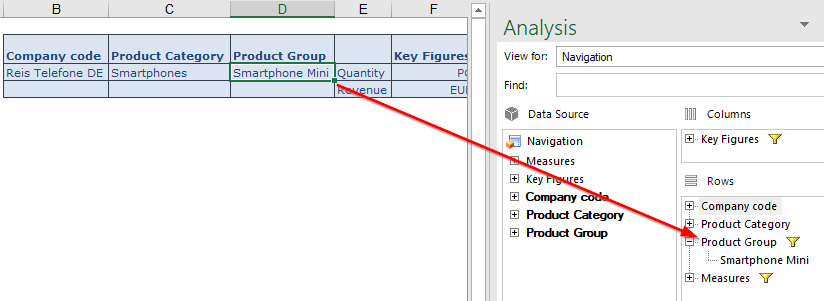
Let’s consider the following example. The initial drilldown of the report displays company codes and product categories.
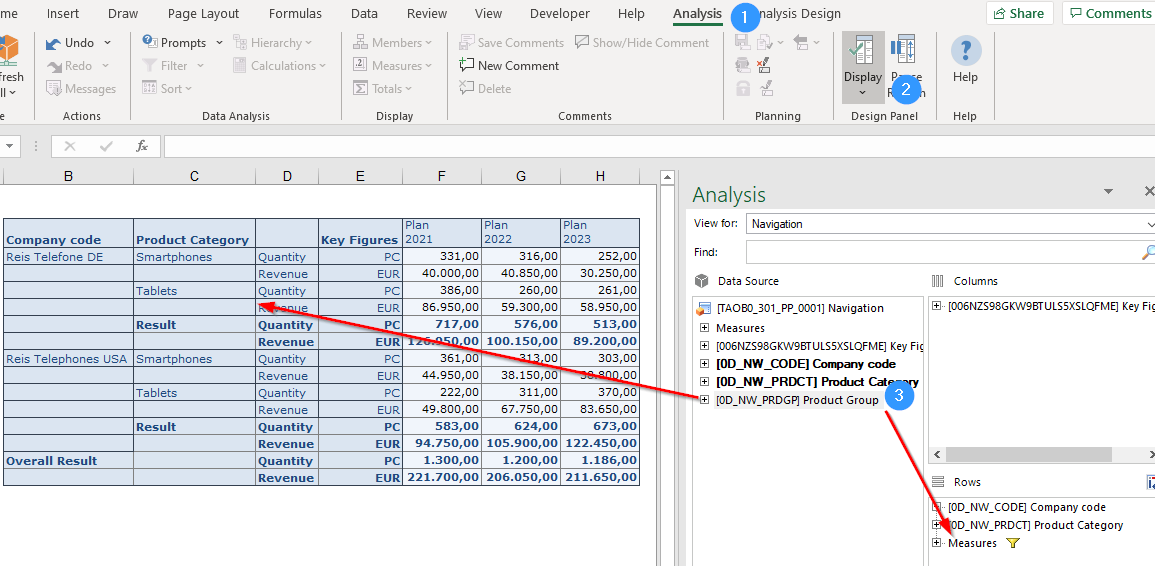
In order to see the values on a more granular level (for example, product group), you can use free characteristics. Go to the Analysis ribbon (1 on the figure below), select Display (2), and the Design Panel will appear. Now you can choose the required characteristic and drag and drop it into rows or columns. Another option is to drag them straight into the crosstab (3).
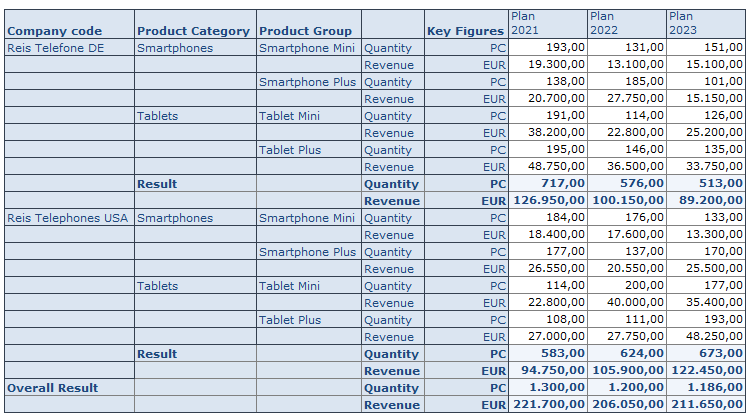
The report will also show data on the product group level and you can analyze the individual product groups. For example, revenue on Smartphone Mini vs. Smartphone Plus.
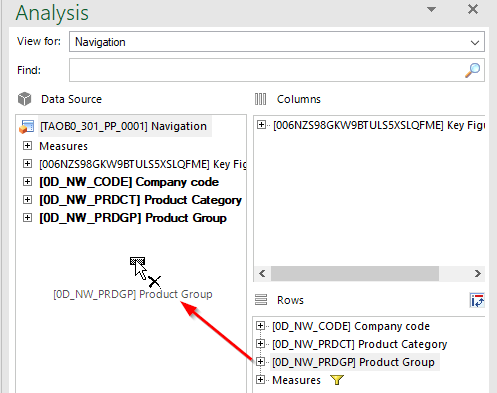
You can also remove characteristics from the drilldown in order to show the data on a more aggregated level. To do so, just drag and drop the characteristic from rows or columns to the list of free characteristics.
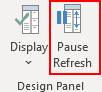
One more tip: if you want to add several characteristics to the drilldown, one after the other, or remove some characteristics from the drilldown at the same time, it is recommended to pause the refresh. This is because every time you change the drilldown of your crosstab, the display is updated and the values are recalculated. This can take some time if there are a lot of values.
The Pause Refresh option allows you to disable the automatic update and create a new view of your data without interruptions. You can insert new characteristics in rows or columns, adjust key figures, or set up background filters. If you select the Pause Refresh option again, the update will be reactivated. All previously defined navigation steps are executed at once.
2 Filtering
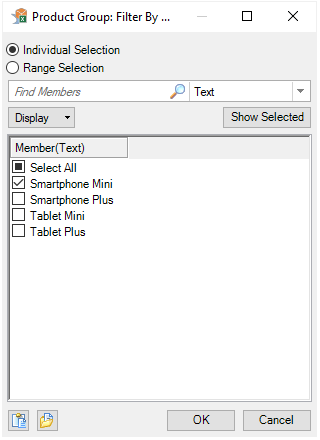
There are multiple ways to filter on desired values. In the Design Panel, you can right-click on the characteristic to be filtered and select Add to Filter (By Member).
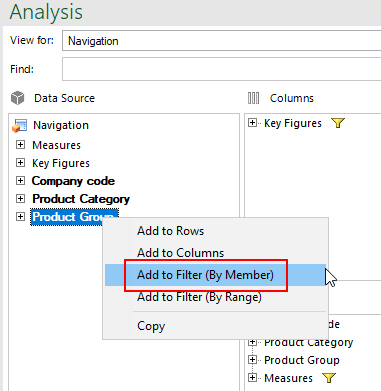
Afterwards, the values to be filtered can be selected.
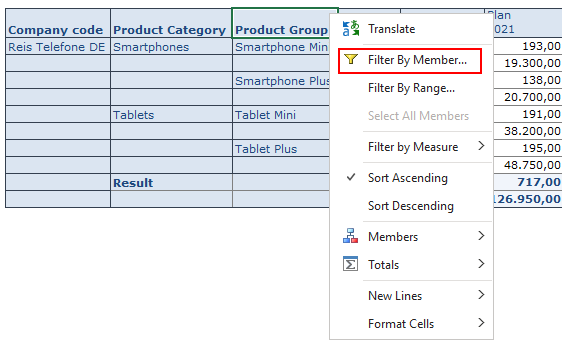
You can also achieve the same result by right clicking on the characteristic in the report and selecting Filter by Member from the context menu.
However, the fastest and the easiest way is to double-click on the specific value. This way, the filter will be automatically set to this value.
3 Unhide Columns
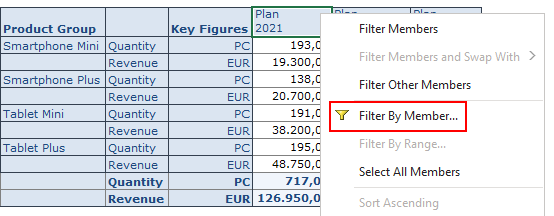
Reports may contain additional information, like growth between periods in absolute values and percentage. These columns might be initially hidden so the report is not overloaded. In order to display this information, right-click on any column and select Filter by Member from the context menu.
Afterwards, you can select the columns to be displayed. For example, Growth % 2022.
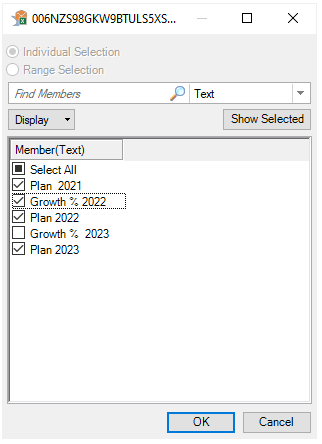
After you click on OK, the additional column is shown in the report.
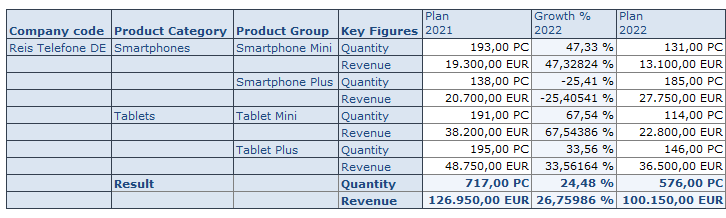
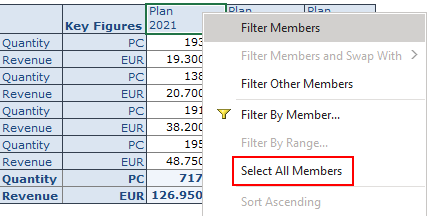
In order to display all available columns, click on Select All Members in the context menu.
4 Repeat Members
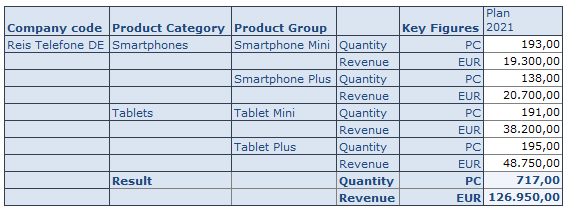
By default, the description of characteristics is shown only in the first line. For instance, the description of the company code is displayed in the first line, followed by blank cells.
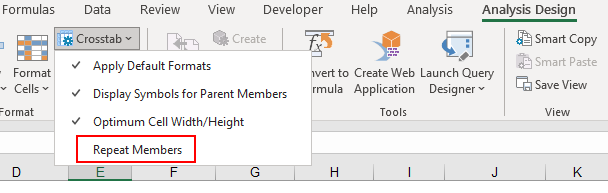
If you want to display the description in every cell, go to the Analysis Design tab. Open the Crosstab menu in the Format group and select the Repeat Members setting.
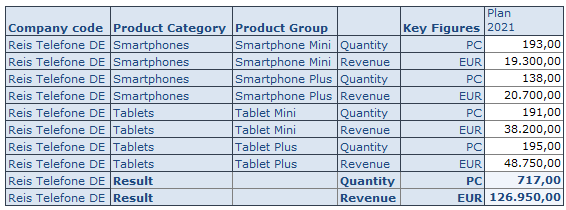
After that, the descriptions are shown in every cell.
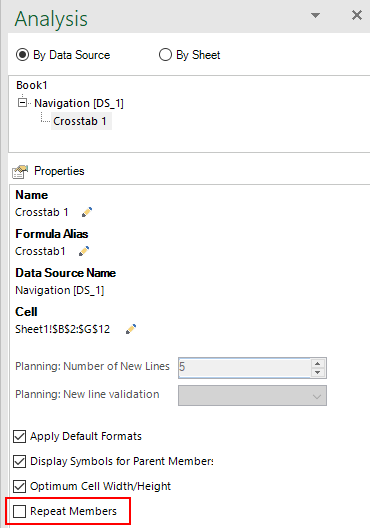
If you want to save this setting with the workbook, you have to display the Design Panel and select the Components tab. Select your query (Data Source), unfold, and select the correct crosstab. Under properties, tick the box Repeat Members.
5 Display Keys
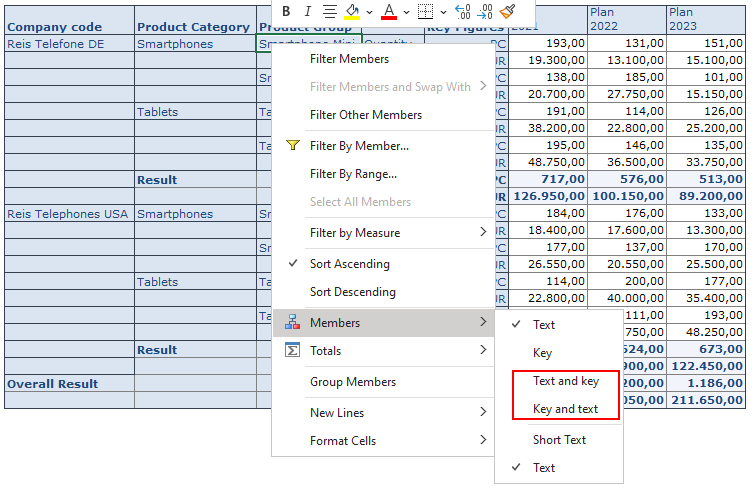
Some reports may show members as text only per default. There might be two entries with the same description, which is misleading, whereas the technical keys are always unique. In order to display the technical key, you can right click on a characteristic and change the display by going to Members and choosing Key and text or Text and key setting.
6 Hide or Show Totals
You can hide or show totals by right-clicking on a characteristic and choosing the Totals menu entry.
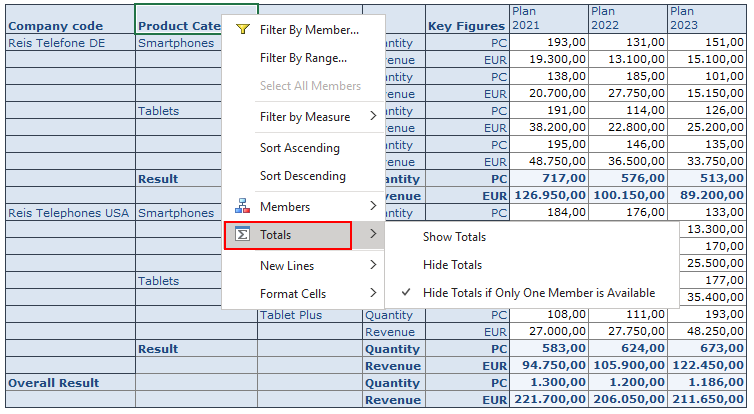
You can hide the totals row completely (Hide Totals) or always display it (Show Totals). You can also display totals only if there is more than one value to be calculated (Hide Totals if Only One Member is Available). Results that consist of only one element are then hidden.
7 Sort
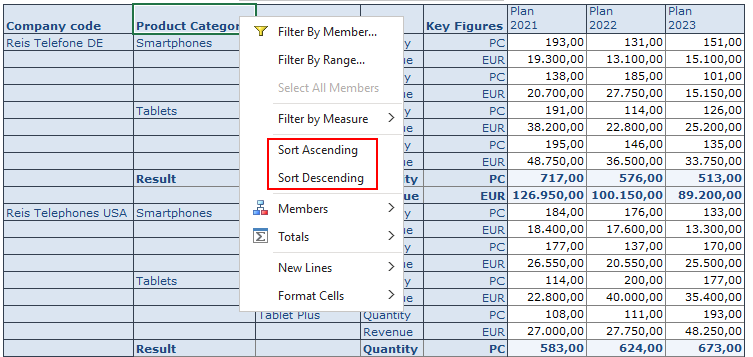
You can easily change the sort order in the query. To do so, right click on the characteristic and select Sort Ascending or Sort Descending from the context menu.
8 Change Prompt Values
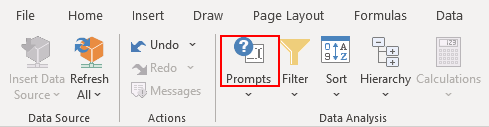
Sometimes the report you use may come with predefined values and won’t show prompts by default. By clicking on Prompts you can change your variable selection.
9 Use Value Help
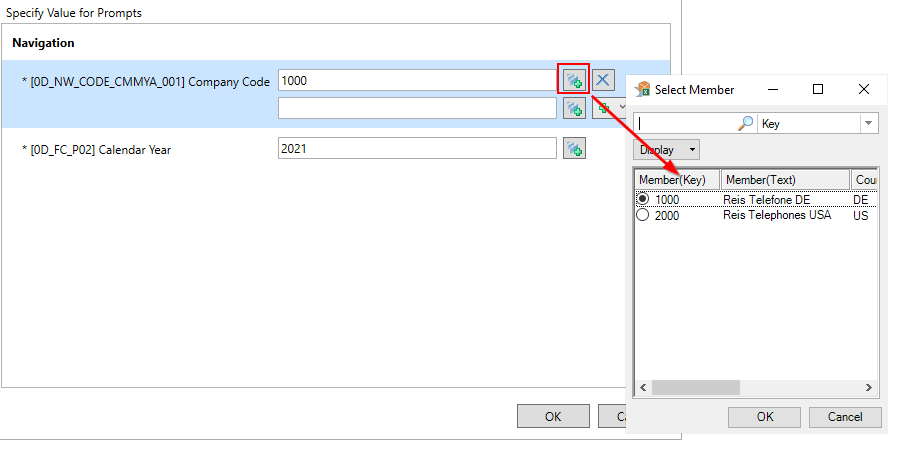
You have to enter the key of the characteristic’s value in the prompt. If you don't know the key for your selection, you can use the value help to find out.
10 Add Line in Prompt
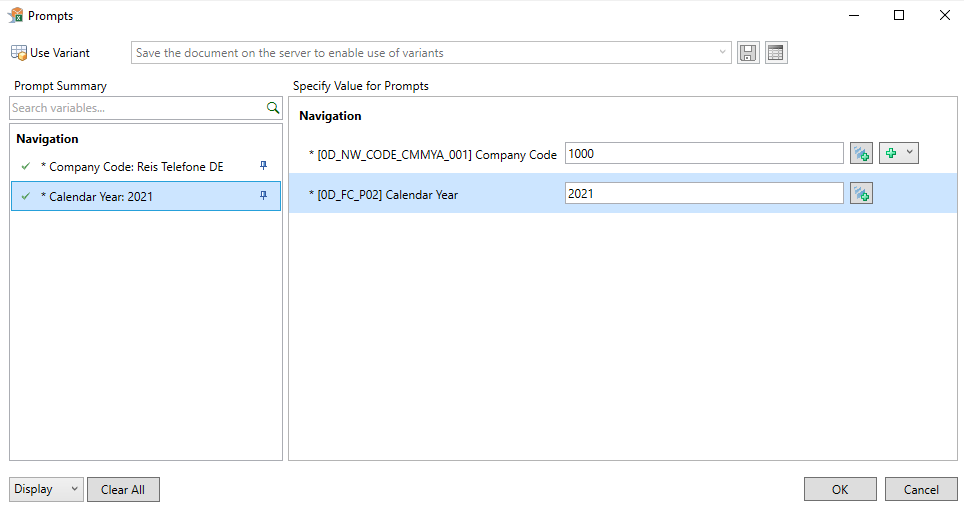
It is possible to select multiple values in the prompts. In order to add a new line, click on the green plus icon. You can add as many lines as necessary.
11 Add Lines Using Filter By Member
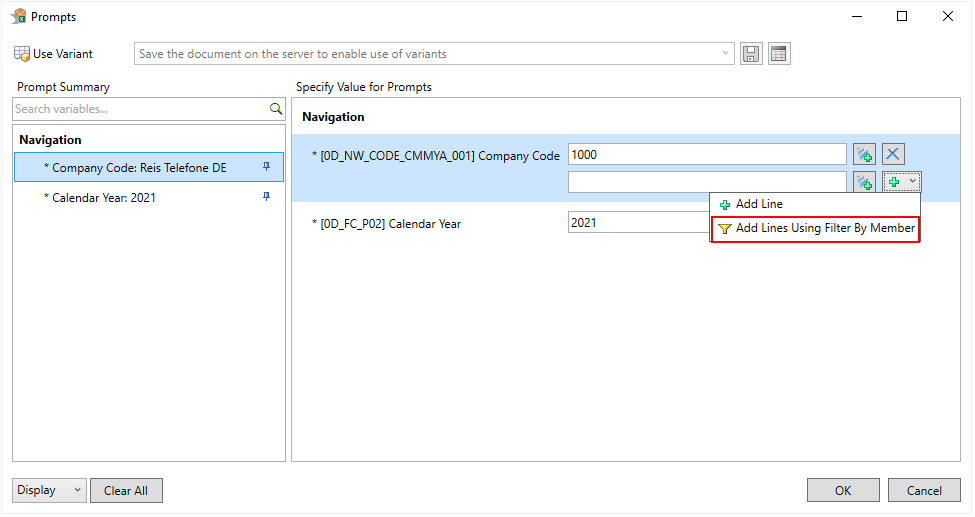
Another, easier, way to select multiple values is to use the filter feature in the prompts. Click on the drop down menu next to the green plus icon. Afterwards, select Add Lines Using Filter by Member entry. Select the desired members and confirm your selection by pressing OK.
12 Explicit Selection
If you select all values in the filter or use the Select All checkbox, nothing will happen at first because this dialog box functions like a filter. If the selection is restricted to all values, no restriction exists for any of the values. If you want to select all values at once, you can use the Explicit Selection setting.
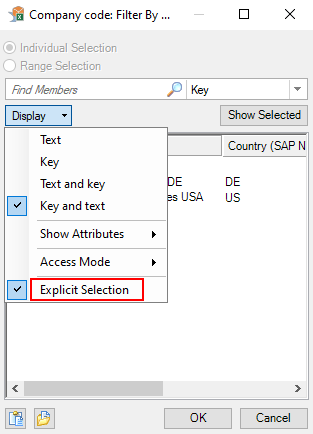
When the Explicit Selection setting is active, values are selected individually. If you click on Select All, the two company codes are selected one by one. You can now click the OK button to add them to the prompt.
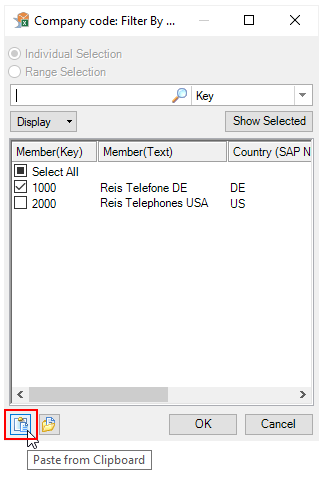
13 Copy Prompt Selections from Excel
Another easy way to select prompt values is to copy them from clipboard. You can copy your selections from Excel, select the drop down menu in the prompt, and click on Add Lines Using Filter by Member. Then, click on the Paste From Clipboard icon at the bottom.
14 Show Master Data in the Value Help
In planning scenarios, you might need to select values for which no transactional data is available yet. To do so, go to value help and select Display. Afterwards, select Values in Master Data as an Access Mode.
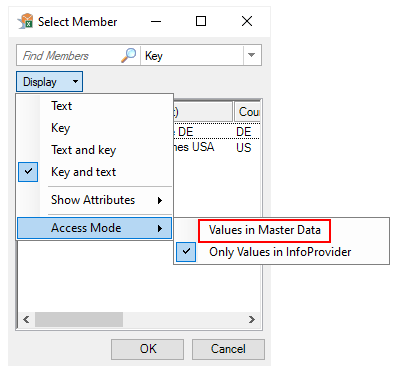
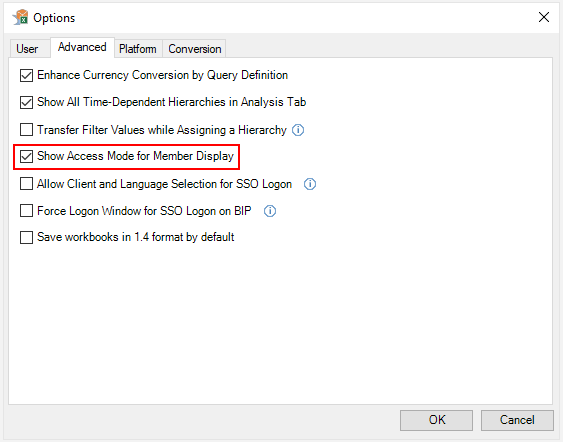
The Access Mode option is only available if you activate the Show Access Mode for Member Display setting in the Advanced options. It is deactivated by default.
15 Save Variant
You can save your selections as a variant to save time in the future. After you have entered your selections, enter a name for the variant. Then save the variant.
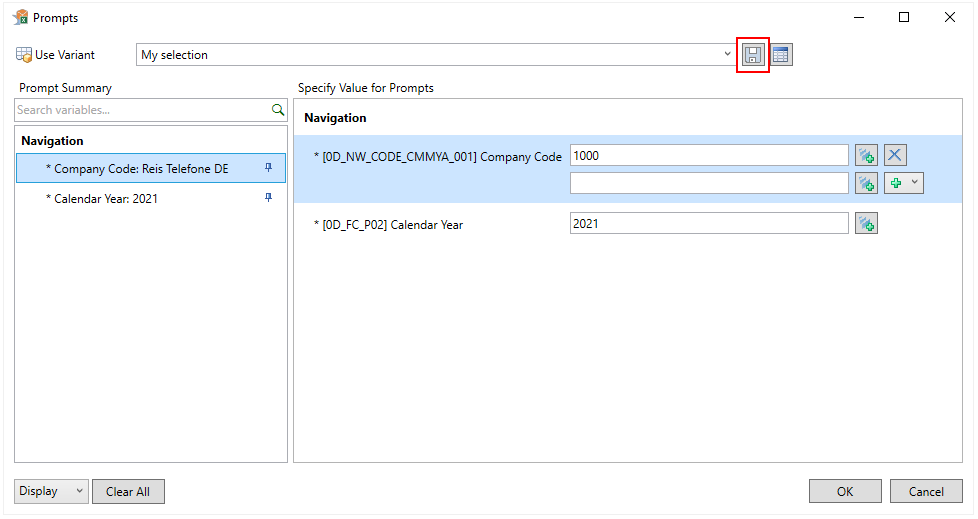
Next time you open the workbook the variant can be selected from the dropdown menu.
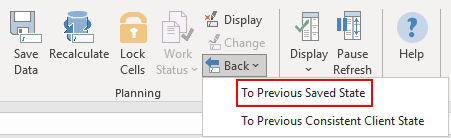
16 To Previous Saved State
When using SAP Analysis for Microsoft Office in a planning context, you might want to reset your changes. Go to Analysis tab and select Back > To Previous Saved State. Changed values will return to the previous saved state.
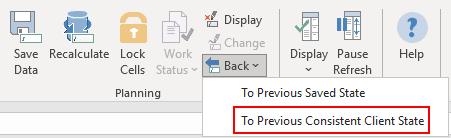
17 To Previous Consistent Client State
There is also the possibility to return to the previous consistent client state by selecting To Previous Consistent Client State option. This option reverses all changes to your data since the last successful recalculation. This feature is useful to return to an original plan when you entered values on an empty cell and disaggregation is not possible.
18 Disable Reset
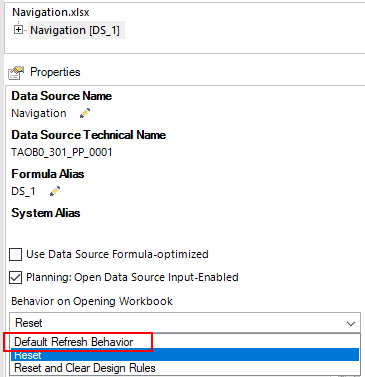
SAP Analysis for Microsoft Office workbooks are usually set up to reset to query settings on opening. This way, your IT department can guarantee you see the latest version of the query. The downside of this approach is that you cannot save your navigation state with the workbook.
If you want to save your favorite drilldown locally, display the Design Panel and choose the Components tab. Select the query (Data Source) and change the Behavior on Opening Workbook setting to Default Refresh Behavior.
Summary
I hope you enjoyed this little collection of useful hints and learned something new. You can learn more useful tips to facilitate your work with SAP Analysis for Microsoft Office in my book SAP Analysis for Microsoft Office - Practical Guide.
Learn SAP Analysis for Microsoft Office in Our Upcoming Rheinwerk Course!
Turn your Excel workbook into a powerful SAP reporting and planning hub! In three expert-led course days, you’ll learn essential skills for working with SAP data directly in Microsoft Excel. Click on the banner below to learn more and order your ticket.

This post was originally published 11/2021.


Comments