
In this blog post, we’ll explore a use case for using the Purchasing Spend Dashboard app in SAP Analytics Cloud in your SAP S/4HANA reporting.
This allows you to compare the spend for a given set of comparison filters such as supplier, purchasing group, supplier country, material group, plant, or purchasing organization with respect to the total spend. With this app, you can also compare the purchasing spend between the two sets of comparison filters such as current year and previous year.
As a purchaser or a strategic buyer, you can also use this dashboard to monitor and analyze various aspects of purchasing spends via bar charts, column charts, and tables in several tabs such as Overview, Details, Context, Compliance, Off Contract Overview, and Off Contract Details. Let’s take a quick look at these tabs in SAP S/4HANA to understand their key capabilities.
Overview
This tab gives you a quick overview of the purchase order net amount by comparing their values and variance between current year and previous year. You can also get insights into the purchase order net amount by different quarters and their trend from the previous year to the current year (see figure below). As illustrated, the dropdown menu shows the Overview, Details, Context, Compliance, Off Contract Overview, and Off Contract Details tabs that can be used to perform flexible analysis using the Purchasing Spend Dashboard app.
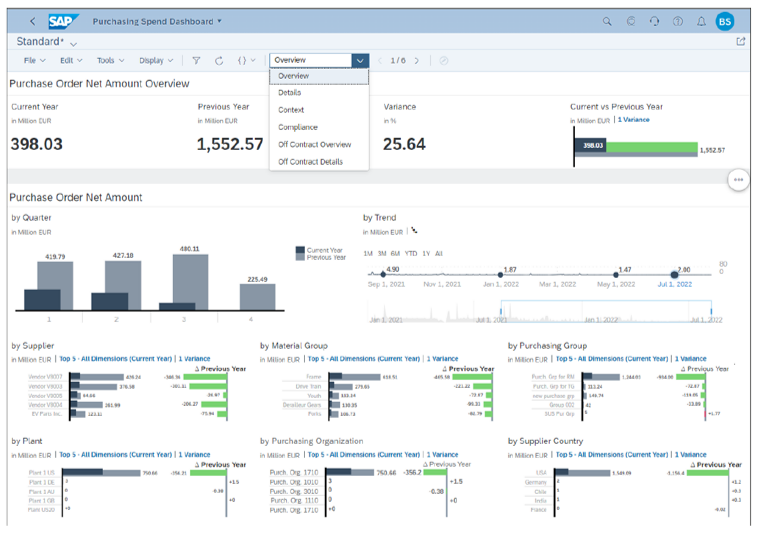
You can see that purchase order variance values between the previous year and the current year are displayed in a comparison chart in the Purchase Order Net Amount Overview section. In addition, the amounts are displayed by Quarter and by Trend in the second chart section and by additional dimensions such as by Supplier, by Material Group, by Purchasing Group, and so on in the third chart section.
Details
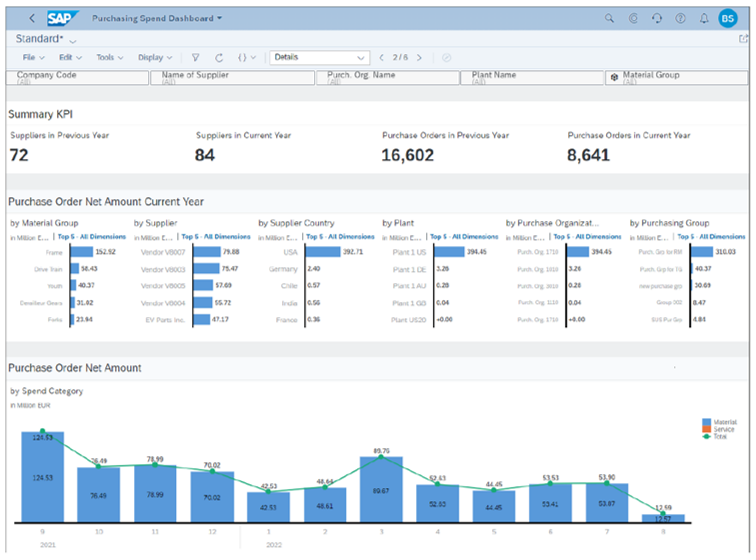
This tab gives you detailed insights into the purchasing spend by displaying summarized KPIs associated with suppliers and purchase orders in the current year and previous year (see below). The Summary KPI values for suppliers and purchase orders are displayed for all company codes, and you can apply required filters to analyze the purchasing spend for thorough analysis using the filter fields.
Context
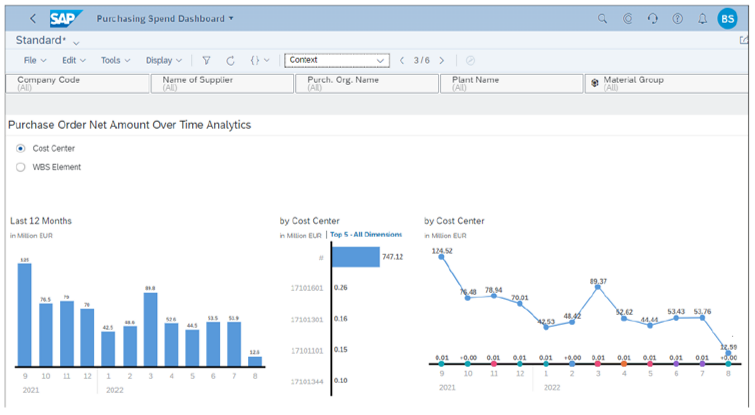
This tab allows you to perform pricing-based analysis in the preceding 12 months and by using cost objects such as cost center or WBS element (see the figure below). For illustration purposes, the purchase order net amount values are displayed over a period of 12 months for all the cost centers. You can also use the WBS Element option to analyze your purchasing spend trend to meet reporting requirements across WBS elements.
Compliance
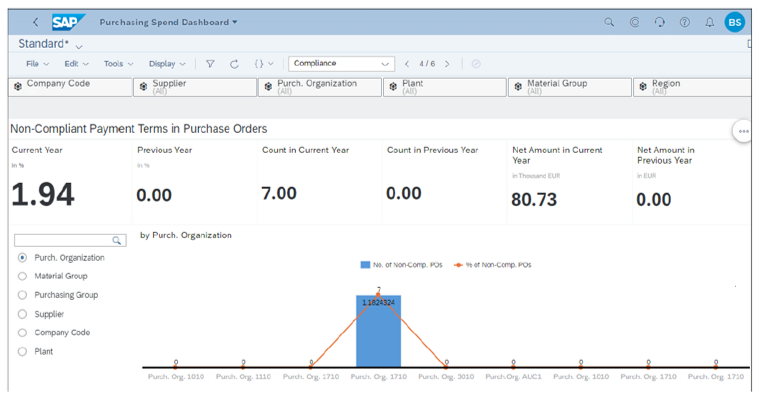
This tab allows you to get insights into the purchase orders with noncompliant payment terms by purchasing organization, purchasing group, material group, company code, supplier, or plant (see next figure). As shown in the app, a total of seven noncompliant purchase orders were created in the current year while the count of noncompliant purchase orders remain zero. You can also see that the percentage of purchase orders with noncompliant payment terms is at 1.94%.
Off Contract Overview
This tab gives you the overview of total spend on the purchase orders with no reference to any purchase contract.
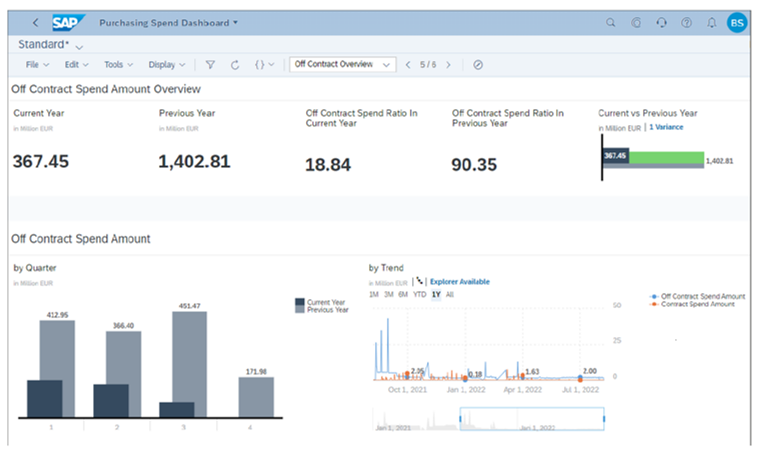
The first chart displays the off contract spend for the current year and for the previous year along with their ratio for the previous year and for the current year, and the second chart displays the off contract spend in individual quarters of the current and previous year along with a trendline for the spend.
Similarly, you can use the Off Contract Details tab to get detailed insights into the total spend on the purchase orders with no reference to any purchase contract and analyze them differently using different charts available in the app.
To create additional analytical and KPI-based scenarios, you can leverage existing CDS views and analytical queries that are behind the existing analytical and KPI-based SAP Fiori apps within procurement. Via SAP Fiori-based key user tools such as the View Browser app and the Custom Analytical Queries tool, you can copy and create customized views and queries to meet additional reporting and KPI-based analytical requirements.
Learn SAP Analytics Cloud in Our Rheinwerk Course!
Master SAP Analytics Cloud! Learn how to connect and model data, create visualizations, work with planning models, and use predictive analytics. This five-day course provides a comprehensive introduction to the core capabilities of SAP Analytics Cloud and its all-in-one BI functionality. Get access to course recordings by clicking the banner below.


.png?height=600&name=Embedded%20Analytics%20Content%20Delivered%20with%20SAP%20S4HANA%20(1).png)
Comments