
In this blog post, we will look at general settings that might improve performance in SAP Analytics Cloud.
Starting with the handling of multiple models and so-called query merging, we will then move on to the optimize story building performance mode and look at when a re-save might be useful. Afterwards, we will then take a detailed look at the optimized view mode, a package of features to improve usability and performance. Finally, we will show the various performance warning notifications provided by the system as additional user guidelines and take a brief look at the progressive chart rendering feature.
Using Multiple Models in a Story
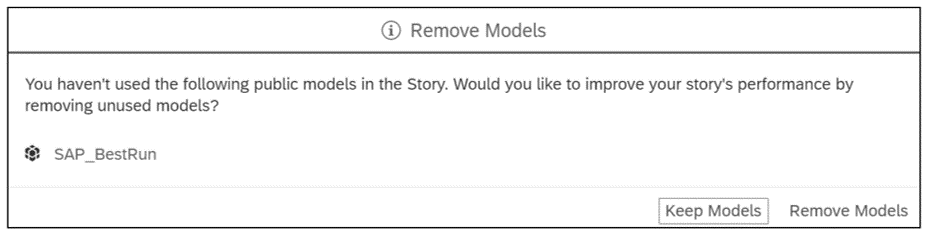
A few points must be mentioned about data models. One thing that might seem obvious but is nevertheless often overlooked is removing unused models from a story. It happens quickly: A dashboard is created and suddenly an error is noticed in the data model, which is then completely recreated and added to the story. The old model often remains unused in the story. From a performance point of view, this is unnecessary ballast for our story, so when saving, the user is informed about the unused models with the suggestion to remove them from the story, as shown in this figure.
If a story uses more than one model, these are often linked via a common dimension. To ensure performance, the number of linked models should be kept as low as possible, and the linking should not be done by using a calculated dimension.
Query Merging
For each data-related object within a story, SAP Analytics Cloud executes a backend request. The number of queries executed in parallel can be manually increased by batching queries together to reduce the number of browser requests. This can be applied for stories that use an SAP HANA or SAP Business Warehouse (SAP BW) system as a data source, provided your data source provider allows this.
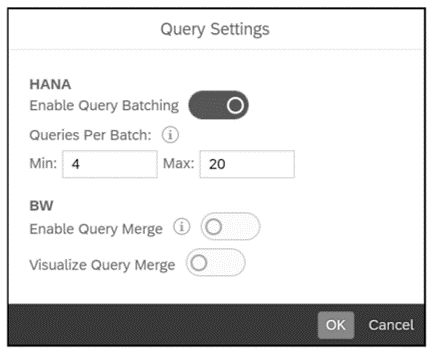
To enable query batching and merging, as shown in the figure below, follow these steps:
- In your story, click on the Settings wrench tool.
- Select Query Settings.
- When using an SAP HANA database:
- Toggle on Enable Query Batching.
- Set a Min and Max number of queries per batch.
- When using an SAP BW database:
- Toggle on Enable Query Merge.
- When using an SAP HANA database:
Optimize Story Building Performance
Performance impairments can occur not only when loading a finished dashboard, but also in the middle of the building process. If you activate the Optimizing Story Building Performance function in the model presets, an automatic data update during story design is prevented.
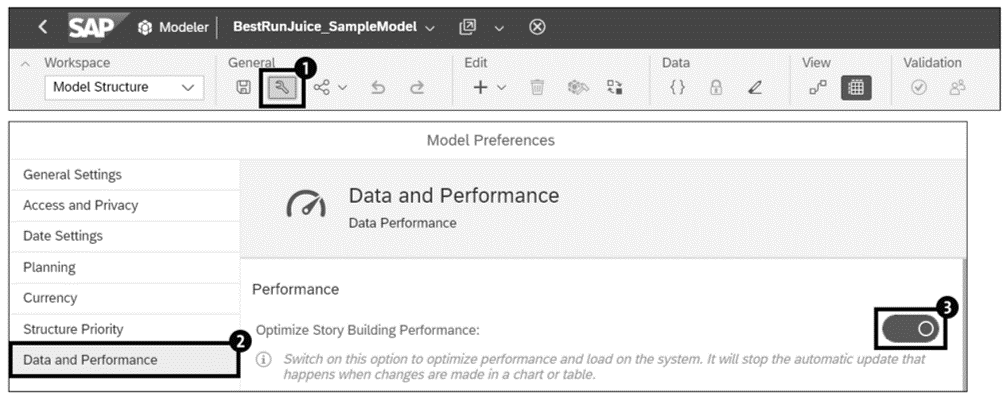
To turn off the automated data update during story design, follow these steps, as shown in the following figure:
- Open the corresponding model and click the wrench tool to enter the modeler’s settings menu.
- Select the tab Data and Performance.
- Toggle on the switch under Optimize Story Building Performance.
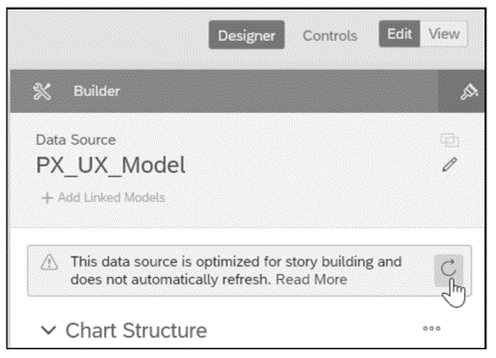
Whenever required, the data update can be triggered manually within the story builder in the builder panel of the respective chart during the building process, as shown in this figure.
Re-save the Story
The SAP Analytics Cloud product management team is continuously working on improvements within the tool. Updates are therefore applied on a regular basis. To benefit from these improvements, it is recommended that you open and re-save the story after each update release and thus transfer technical updates to your own stories or analytical applications.
Optimized View Mode
With the Q3 2021 release of SAP Analytics Cloud, optimized view mode has been introduced. This mode can be activated individually for each story and, in addition to features for simplified handling in view mode, also offers improvements in the performance area, which we will look at in more detail in the following sections.
Note: It should be noted here that optimized view mode does not correct any performance weaknesses resulting from problems in the backend or network, such as slow-running backend queries (server-side) or a sluggish network. Instead, optimized view mode addresses dashboards with client-side performance issues only.
Enable Optimized View Mode
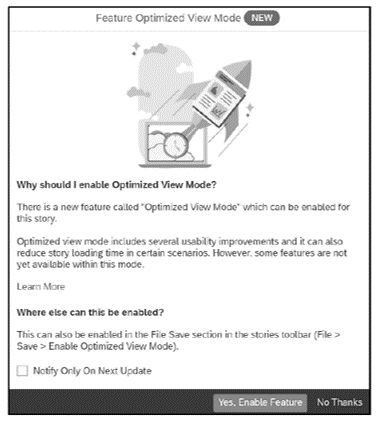
Enable optimized view mode via pop-up with these steps:
- Open the relevant story.
- Enter the Edit
- In the pop-up that opens next, click on Yes, Enable Feature, as shown below. Click the Learn More link for further information about optimized view mode.
Enable optimized view mode in the Save menu with these steps:
- Open the relevant story.
- Enter the Edit
- At the top menu bar in the File section, enter the Save dropdown menu and select Enable Optimized View Mode.
Active Viewport Rendering
With the optimized view mode, the user now has the option of activating active viewport rendering. Only those objects that are in the visible screen area are rendered. This has a positive effect on performance, especially for large dashboards with many data-dependent widgets that can be viewed only with a lot of scrolling. Any content outside of the viewport will not be rendered until the user actively brings it into the visible area by scrolling.
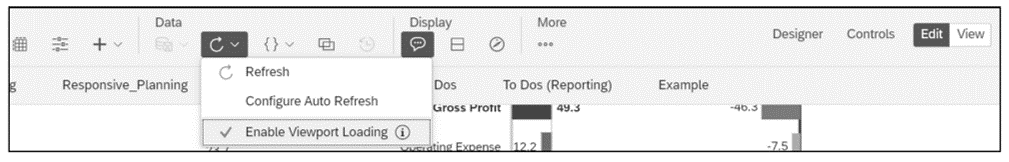
To enable active viewpoint rendering, follow these steps:
- Open the relevant story.
- Switch to Edit
- Under the dropdown menu of the Refresh button, click on Enable Viewport Loading, as shown in this figure.
Improved Rendering on Story Open for the First Page in a Dashboard
In the optimized view mode, the rendering of the first page when opening a story has been accelerated. This is done using persisted query information, which is created after a story is saved in optimized view mode. Whereas, outside of the optimized view mode, the first few seconds of opening a story are used to create all available queries, persisted query information is used to deal with widget rendering and server processing in parallel. With this, data-related queries can be sent to the backend earlier, which allows a faster rendering of the first page.
Ghost Loading Indicator
When opening a story in optimized view mode, an animated ghost widget is displayed instead of the loading icon, which provides the user with information about the expected widget type even before the actual chart is available. Even if this additional function does not really speed up the actual loading process, it is still comforting advance information to bridge the rendering time.
Model Information Downloaded on Demand
A main approach to improving client-side performance in optimized view mode is to no longer load all available data information from the model per se when opening the story, but to load data only on demand and then only the information that is actively requested by performing an action.
This has an effect, for example, when switching to another story page, expanding a filter, and filtering by data point selection.
The optimized view mode also accelerates the loading of complex hierarchies since information of lower-hierarchy levels is loaded only by consciously expanding the corresponding parent node. In addition, those hierarchy members for which no data is available due to filter settings are hidden by default. Besides improving rendering time, this also leads to a better overview of the available members.
Limitations to Performance Improvements
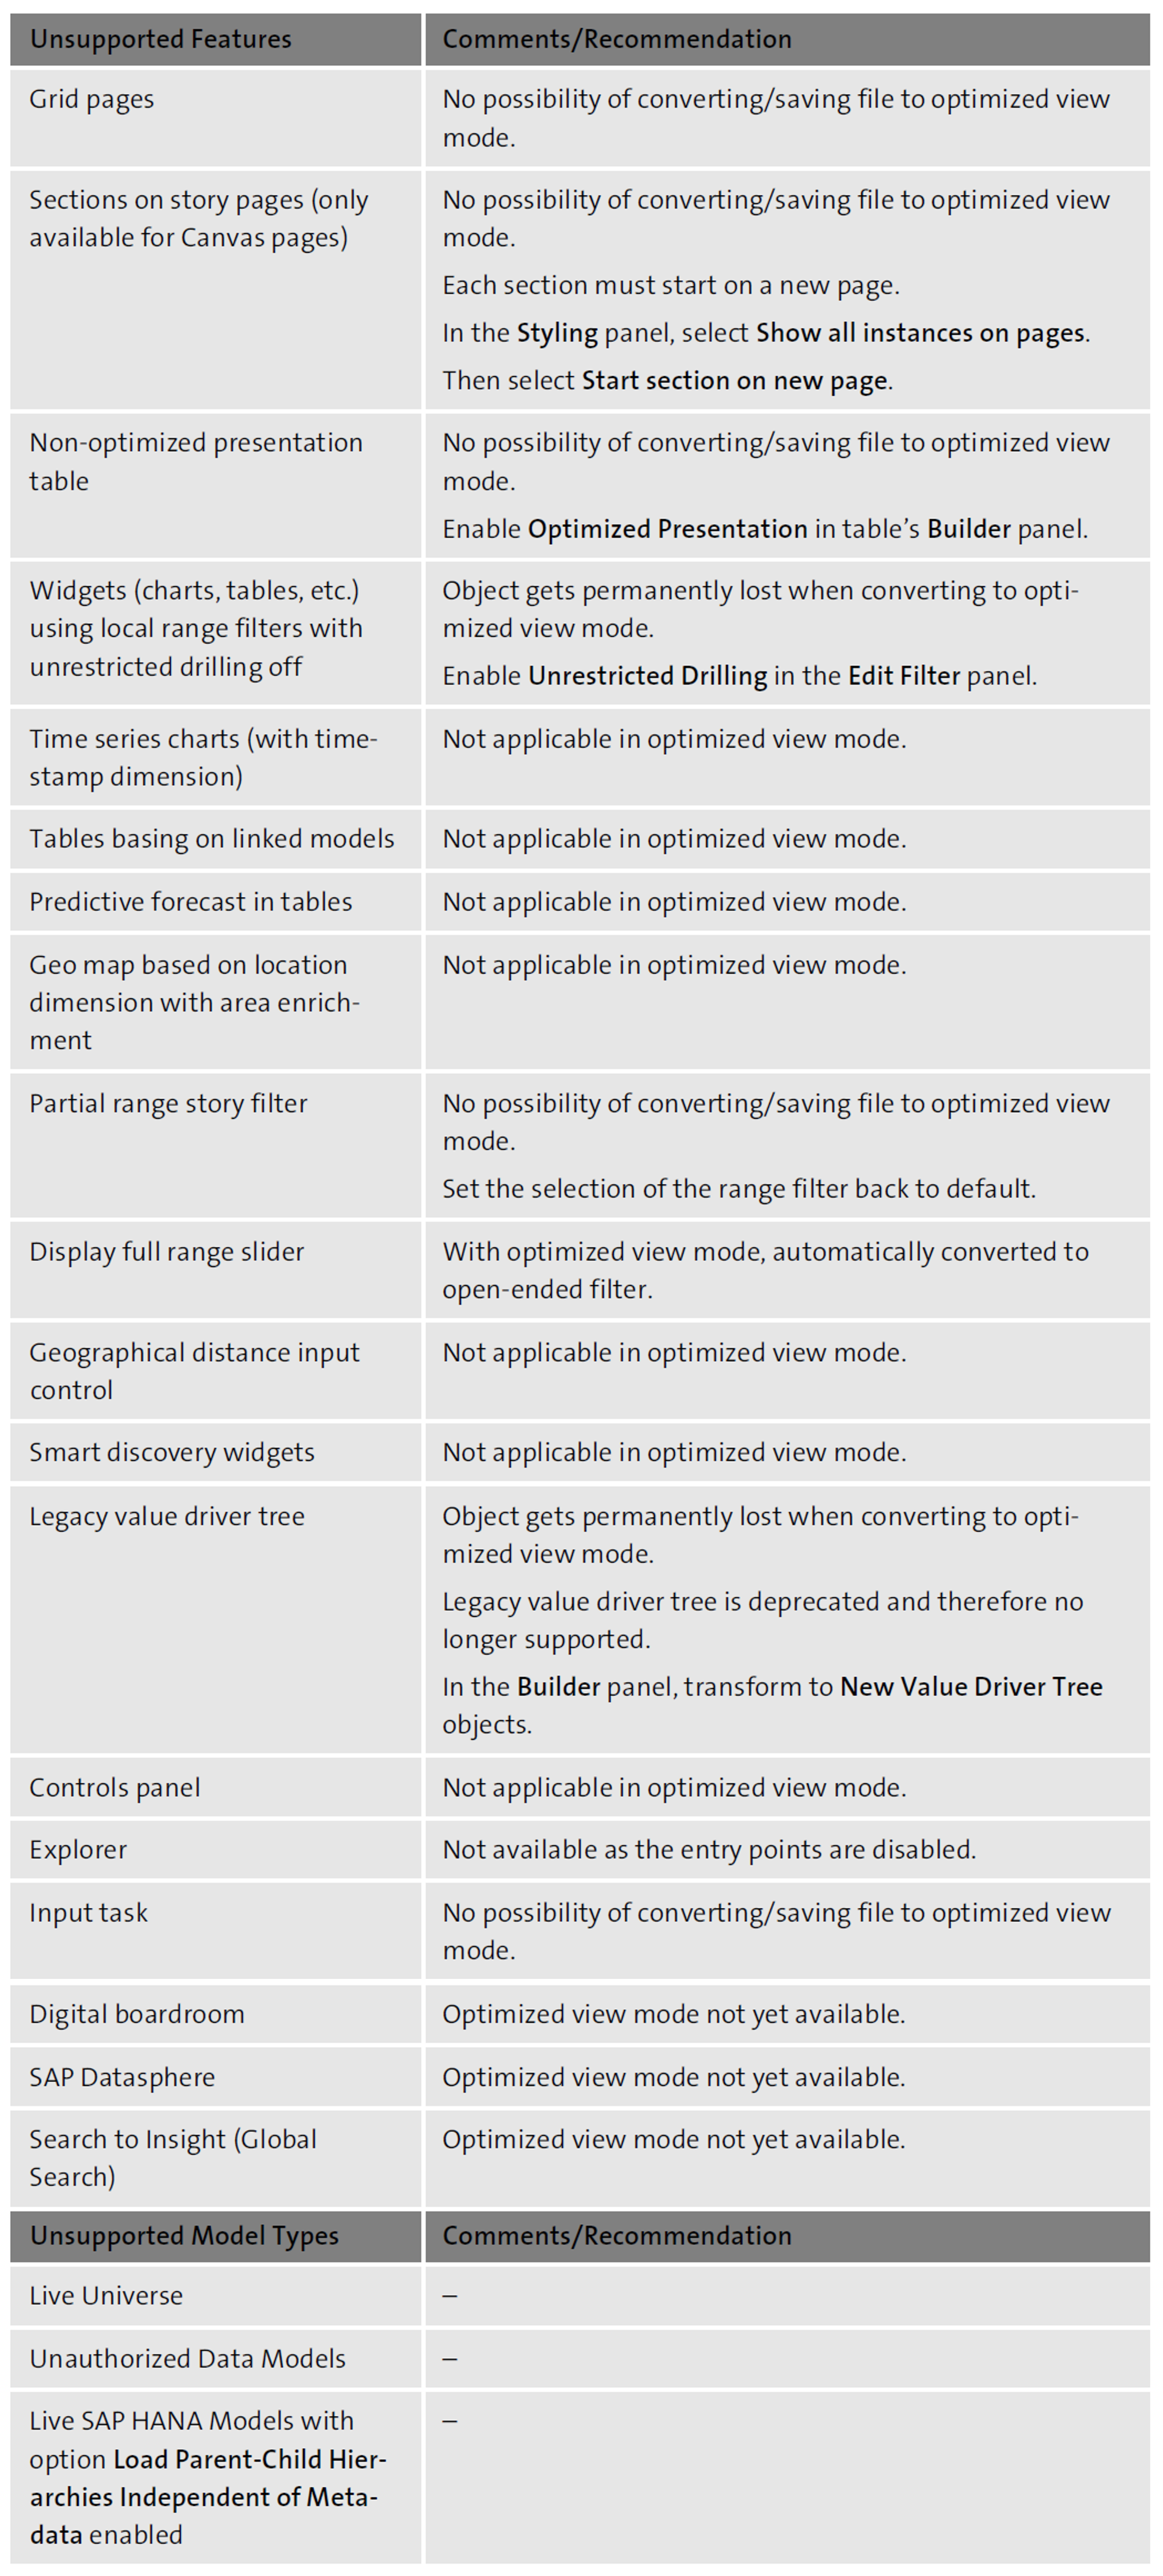
The optimized view mode does not cover all features in SAP Analytics Cloud. Some of those even might have to be removed or changed before the story file can be converted into the optimized view mode. In the table below, we show a list of features and in-built tools that underline the limitations of using the optimized view mode. Keep in mind that these limitations are likely to change over time as work is continuously done to improve both the functionality of individual SAP Analytics Cloud features and their compatibility. You can check the current list of restrictions on the SAP Analytics Cloud Help Portal at the following URL: http://s-prs.co/v566901.
Further Reading
You can find more information on performance improvement limitations from the following resources:
- Tunir Kapil, “Experience Performance and Usability Improvements with SAP Analytics Cloud Stories,” available at http://s-prs.co/v566902
- Tunir Kapil, “The New Rendering Experience – Active Viewport Rendering,” available at http://s-prs.co/v566903
- SAP Analytics Cloud Help Portal, “Optimized Story Experience Restrictions,” available at http://s-prs.co/v566904
- SAP Analytics Cloud Help Portal, “Optimized Story Experience Improvements,” available at http://s-prs.co/v566905
Performance Warning Notification
In addition to the best practices recommended in this book, there are performance improvement tips that appear automatically in the dashboard creation process, i.e., only in edit mode, and thus draw the user's attention to performance traps during the design process. For the following situations, a notification will show up:
- Too many pages are added to a story
- Too many widgets are added to a page
- Designer is told to collapse filters
- Designer is told to enable optimized mode
Progressive Chart Rendering
Another setting that we would like to mention at least briefly is the so-called progressive chart rendering feature. Activating this setting shortens the waiting time while a story is opened or refreshed. A version of a chart is retained for one hour and then displayed as a kind of temporary placeholder for the duration of the data refresh process. If the user tries to interact with this chart during this time, he will be informed by a loading icon that this chart is still in the update process. This feature can be particularly helpful if there have been no drastic changes in the story, such as data changes, but only minor ones, such as changes in the design, within the last hour.
Note: You will need an admin role to access the system configuration settings.
Learn SAP Analytics Cloud in Our Rheinwerk Course!
Master SAP Analytics Cloud! Learn how to connect and model data, create visualizations, work with planning models, and use predictive analytics. This five-day course provides a comprehensive introduction to the core capabilities of SAP Analytics Cloud and its all-in-one BI functionality. Get access to course recordings by clicking the banner below.


Comments