SAP Integrated Business Planning (SAP IBP) provides best practice content via SAP Best Practices to highlight how the various capabilities of SAP IBP can be utilized to achieve a successful S&OP process.
This best practice content can be used as a guide or as the starting configuration for a project.
The overall process flow modeled in the best practice solution is shown in the figure below. We’ll discuss each segment of the process flow in more detail in the following sections.

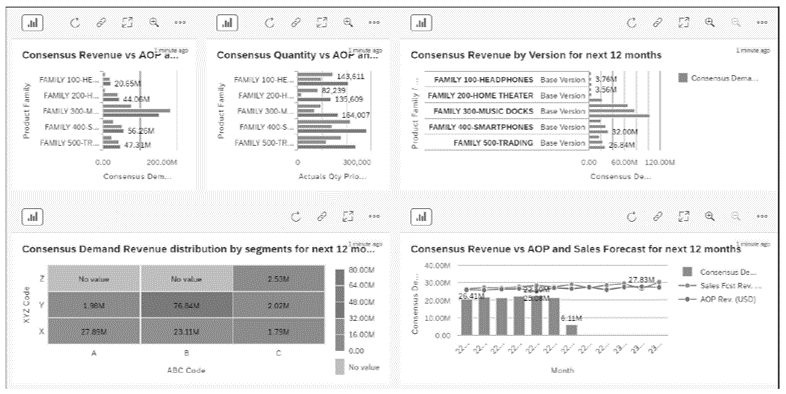
Demand Review
The demand review process within the S&OP has several sub-steps and data sources, as shown here.

Demand review covers a sequence of steps controlled through the process management capability. Planners also have access to this capability through the demand planner dashboard. As shown in below, the demand review involves the following sequence of steps:
- Product segmentation (on the left), which helps to determine the right demand planning strategy for each product.
- A sales forecast review, which may include a new product introduction as well. The sales forecast is stored as a key figure in SAP IBP and can be pulled for review in a Microsoft Excel planning view.
- A marketing forecast review, where the marketing forecast key figure is pulled for review into a Microsoft Excel planning view.
- An annual operations planning (AOP) review, which looks at the AOP key figure brought into a planning view.
- A consensus demand, which receives an input behind the scenes from statistical forecasting to receive the global demand plan.
- A final consensus demand plan, which is a key figure that serves as a standard input into the supply review process.
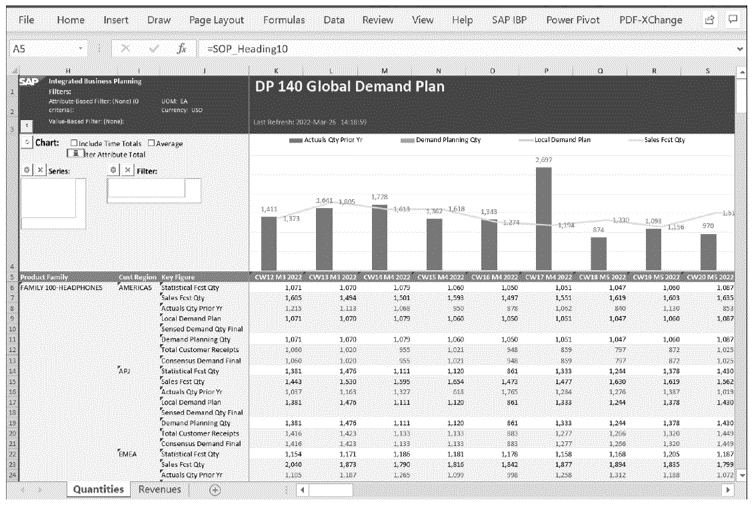
The next figure shows an example Microsoft Excel planning view with the data to perform the demand review. The chart also shows trends in the actual quantity.
Supply Review
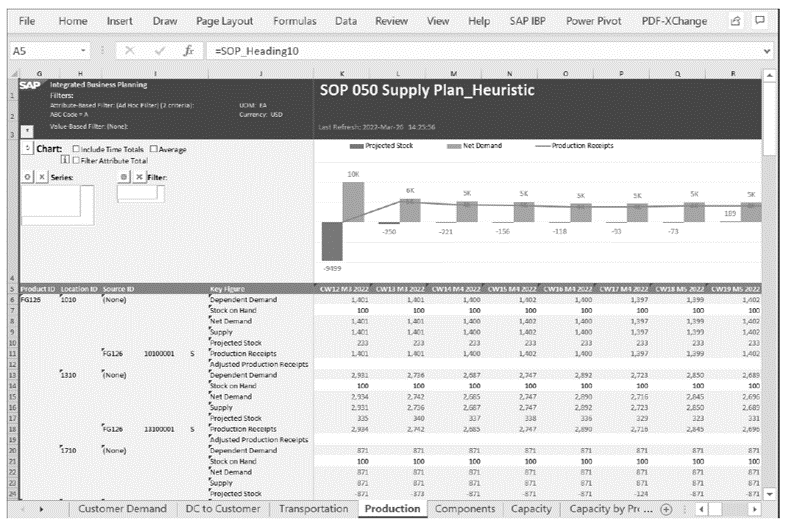
The supply review process flow comes next and is managed through process management. The figure below shows an example planning view with the key figures relevant for supply planning.
The supply review begins with the inputs from the demand review and the behind-the- scenes inventory optimization. Let’s walk through the process:
- As a first step, the S&OP infinite supply planning heuristic is triggered to generate the capacity consumption output.
- You then can review the capacity situation by pulling in several key figures, such as the Capacity Supply, Capacity Consumed, and Capacity Utilization key figures, into a planning view.
- You can adjust the production and distribution plan based on the capacity review to come up with the desired plan.
- You can optionally make adjustments, run simulations, and store the results in scenarios. This flexibility provides you the ability to analyze whether alternatives could lead to better planning results and to take corrective actions for subsequent runs.
- The final plan, after supply adjustments, is used for the subsequent reconciliation review step.
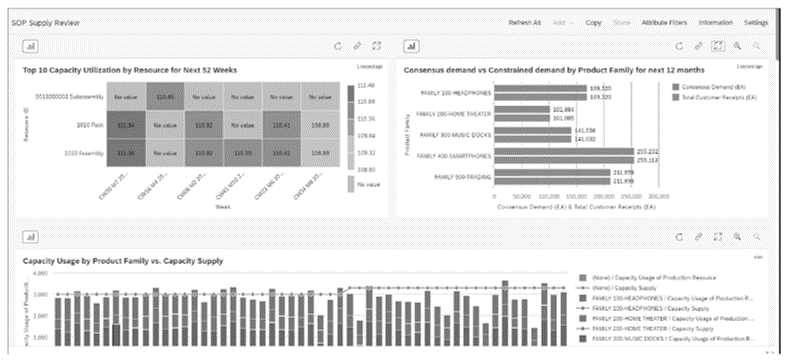
The following figure shows an example supply review dashboard. Notice how, in this phase, the important key figures are related to the capacity and production.
Reconciliation Review
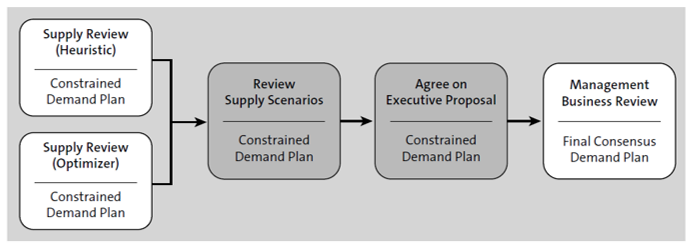
The reconciliation review process, as shown below, looks at the supply and demand plans and comes up with the agreed proposal before the final review by management.
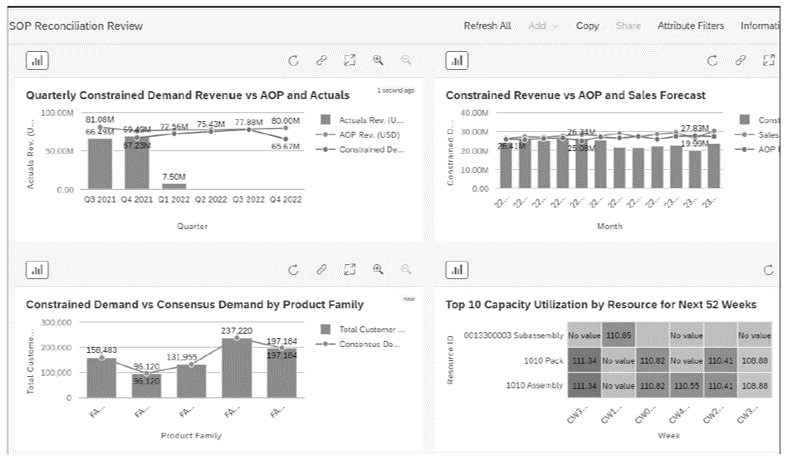
The next figure shows an example dashboard used by planners during reconciliation review. This view normally includes all the different aspects of the supply chain: demand, production, capacity utilization, and so on.
Management Business Review
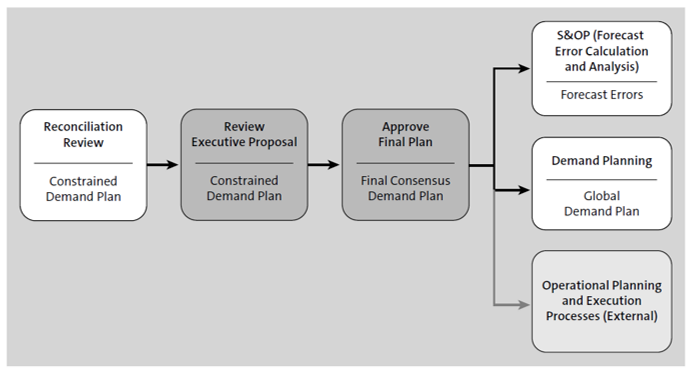
Management business review (sometimes abbreviated MBR), as shown below, is performed by management executives together with planners from all areas with the goal of coming up with an execution plan. The output from this meeting is critical and drives the implementation of the plan throughout the organization. For example, additional resources, additional shifts, or changes in contracts with vendors may be outputs from this phase.
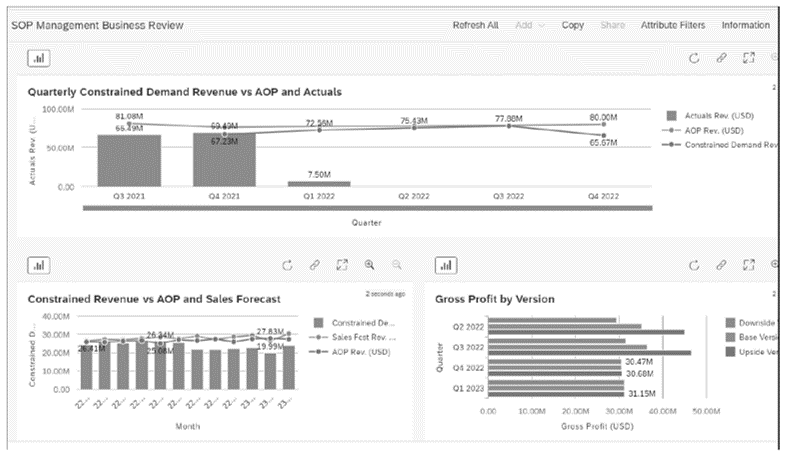
The following figure shows an example configuration of a management business review dashboard. This dashboard displays several key figures including revenue, profits, and more.
Editor’s note: This post has been adapted from a section of the book SAP IBP for Supply Chain Certification Guide: Application Associate Exam by Parag Bakde and Rishabh Gupta.


Comments